King County’s median home price held at $887,300 in October 2025, according to the Northwest Multiple Listing Service. In Scottsdale, that same equity accesses the Phoenix Valley’s most premium destination market with a $2,600+ annual property tax advantage, Arizona’s 2.5% flat income tax, and materially more indoor-outdoor living space per dollar than the Pacific Northwest’s comparable price band.
The Seattle-to-Scottsdale transaction is not the same arbitrage as California- to-Phoenix. The two origin markets trade at similar price levels. King County’s median held at $887,300 as of October 2025 per NWMLS, while Scottsdale’s median sale price reached approximately $900,000 to $995,000 in the second half of 2025, per ARMLS and Scottsdale REALTORS data. On a headline number basis, the two markets are near-peers.
That matters, because it changes the financial argument. For Seattle homeowners, the Scottsdale case is not primarily about retaining six figures in cash after a transaction though that remains possible depending on the specific sale price, mortgage balance, and target home. The case is about three other financial levers that function independently of the purchase price itself.
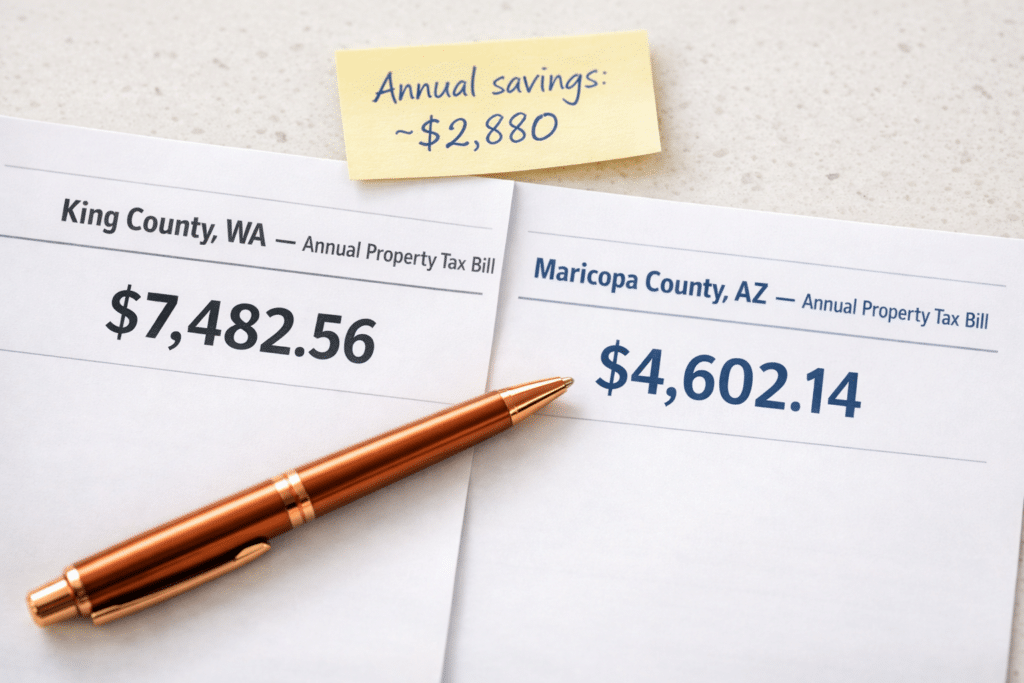
The first lever is property tax. King County’s median homeowner pays approximately $7,292 per year in property taxes the highest in Washington state, per King County Assessor data and SmartAsset’s 2025 analysis. King County’s effective property tax rate is 0.84% of assessed value. Maricopa County’s median effective rate is 0.52%, per the Maricopa County Treasurer. On a $900,000 home, the annual property tax difference between the two counties is approximately $2,880. Over five years, that is $14,400 in retained capital that does not require a price gap to materialize.
The second lever is income taxes. Washington State has no personal income tax a genuine advantage over California, Oregon, and many other origin markets. But Arizona’s flat 2.5% rate, confirmed by the Arizona Department of Revenue for tax year 2025, is relevant for Seattle homeowners in one specific situation: those who relocate before liquidating significant investment assets. Washington’s capital gains excise tax, enacted in 2022 and upheld by the Washington Supreme Court, applies a 7% rate on long-term capital gains above a $278,000 standard deduction in 2025, with a 9.9% top tier on gains exceeding $1 million above the deduction, per Washington Department of Revenue. Critically, the primary residence sale is fully exempt from Washington’s capital gains tax. However, stock portfolios, business interests, and investment accounts are not. A Seattle homeowner who relocates to Arizona before liquidating a large investment position reduces their capital gains exposure from 7-9.9% (Washington) to 2.5% (Arizona).
The third lever is the space-per-dollar translation. What $900,000 physically buys in Scottsdale desert lot, covered patio, pool-ready backyard, indoor- outdoor floor plan does not exist in Seattle’s comparable price band, where that figure purchases older housing stock on constrained urban lots with minimal outdoor infrastructure.
King County median home price, October 2025 Source: Northwest Multiple Listing Service (NWMLS), November 2025
Estimated annual property tax savings on a $900,000 home: King County effective rate (0.84%) vs. Maricopa County rate (0.52%).
Source: King County Assessor, 2025; Maricopa County Treasurer, FY 2025. Note: Actual bills vary by city, school district, and special levies.
Washington’s tax profile is unique among the coastal origin markets served by this platform. Unlike California (13.3% top marginal rate) or Oregon (9.9% top rate), Washington levies no personal income tax. For Seattle homeowners relocating to Arizona, the income tax argument is therefore different in kind: the immediate annual income tax delta is not the primary driver.
What is the driver is a combination of the capital gains exposure difference and the property tax savings documented above.
Washington’s capital gains excise tax applies to long-term capital gains above the $278,000 annual standard deduction at a rate of 7%, rising to 9.9% for gains exceeding $1 million above the deduction, per Washington Department of Revenue data current as of 2025. The primary residence sale is fully exempt — Washington homeowners do not owe capital gains tax on the sale of their home. But any Seattle homeowner carrying a large brokerage account, equity compensation position, or other investment portfolio faces a material difference in the tax treatment of those gains between Washington (7–9.9%) and Arizona (2.5% flat, per Arizona Department of Revenue, tax year 2025).
For a Seattle homeowner with $500,000 in long-term investment gains above the $278,000 deduction, the Washington capital gains excise tax exposure is approximately $15,540. The Arizona liability on the same gain would be approximately $12,500. For gains well above $1 million, the differential widens further as Washington’s 9.9% tier activates.
On the property side, Arizona also has no estate or inheritance tax, per Tax Foundation state-by-state analysis. Washington’s estate tax applies to estates above $3 million (indexed for inflation, effective July 1, 2025) at a top marginal rate of 35% on taxable estate value above $9 million, per Washington Department of Revenue. For Seattle homeowners building multi-asset wealth positions, the absence of an Arizona estate tax is a compounding advantage measured over years, not a single transaction event.
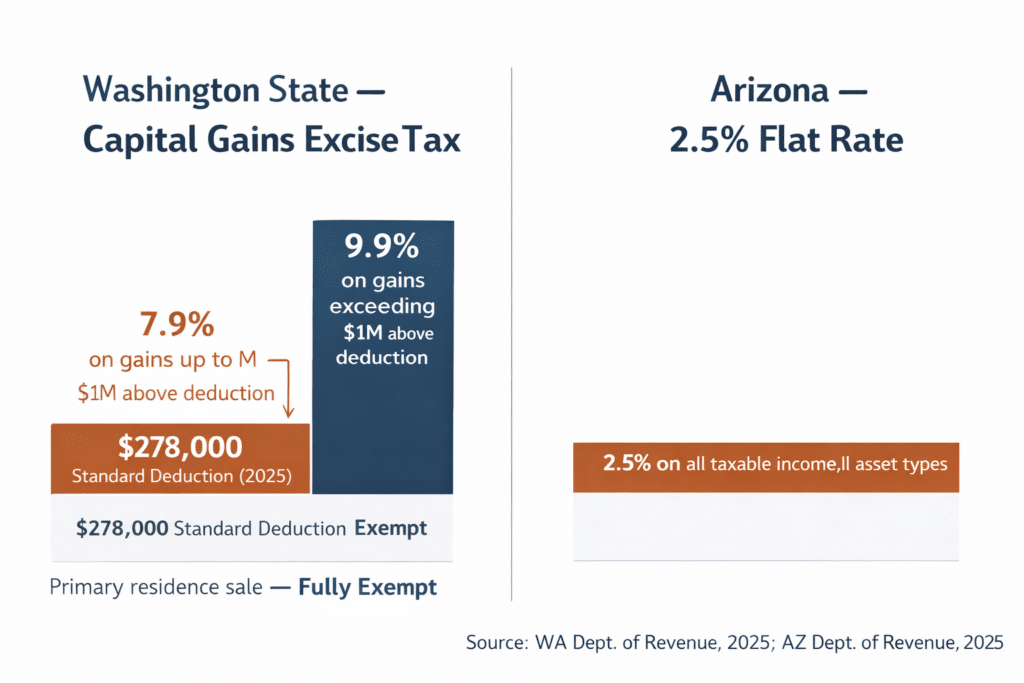
Washington capital gains excise tax rate on long-term investment gains above the $278,000 annual deduction (2025). Primary residence sale fully exempt. Arizona equivalent: 2.5% flat rate on all taxable income.
Source: Washington Department of Revenue (2025); Arizona Department of Revenue (2025); Tax Foundation, 2025 State Tax Competitiveness Index. Note: Tax treatment varies by asset type. Consult a qualified tax professional.
The physical translation of Seattle equity into Scottsdale real estate is where the financial math becomes visible. Scottsdale’s $900,000 price band delivers a categorically different physical product than King County’s comparable tier.
North Scottsdale’s established master-planned communities represent the Valley’s highest-amenity real estate infrastructure. At the $900,000 to $1.1 million price point, this corridor delivers:
– 2,800 to 3,800 square feet of single-story or two-story construction – Covered rear patios designed for year-round outdoor use, typically 400 to 800 square feet of covered outdoor living space – Pool-ready lots as standard; many homes in this range have existing pool and spa installations – HOA infrastructure: gated or semi-gated access, community parks, walking and biking trails along desert preserves, clubhouse facilities – Views: the McDowell Mountains, Tom’s Thumb, and Pinnacle Peak ridgelines form the visual backdrop across the northern corridor – Desert preserve access: the McDowell Sonoran Preserve alone covers over 36,000 acres directly adjacent to North Scottsdale neighborhoods
For context: $900,000 in Seattle’s comparable neighborhoods Ballard, Queen Anne, Magnolia purchases a 1,500 to 2,200 square foot Craftsman or Tudor bungalow on a 4,000 to 6,000 square foot urban lot, typically without covered outdoor living infrastructure, pool, or desert views.
Scottsdale’s luxury segment homes above $1.5 million is where the Valley’s most distinctive physical product concentrates. Seattle homeowners arriving with above-median King County equity (particularly in Bellevue, Kirkland, or Sammamish, where medians routinely clear $1 million to $1.5 million) can access this tier directly. Silverleaf, Desert Mountain, and Mirabel offer custom and semi-custom construction with mountain and golf course positions that have no Pacific Northwest equivalent in the same financial range.
ARMLS data from mid-2025 confirms that Scottsdale’s $1 million-and-above segment saw sales increase nearly 58% year-over-year driven substantially by out-of- state equity buyers, including a documented inflow from Seattle-area markets, per ARMLS and Scottsdale REALTORS 2025 reports.

Source: ARMLS, Scottsdale REALTORS YTD 2025 market reports.
Scottsdale is the premium tier in the Phoenix Valley pricing hierarchy. For Seattle homeowners evaluating multiple Valley communities, understanding Scottsdale’s position clarifies what the premium buys and whether an adjacent community delivers equivalent value at a lower entry point.
or Seattle homeowners whose King County equity positions are near the $800,000-$1.2 million range a broad segment of the market given King County’s median near $887,000 and Bellevue/Kirkland/Sammamish medians materially higher Scottsdale is the Valley community that most directly meets King County’s asset class on price.
The difference is what the price buys physically: lot size, outdoor infrastructure, desert setting, and HOA-managed amenity environment. Greater Phoenix’s overall median sale price was $444,740 in January 2026, per ARMLS STAT (February 2026 release), confirming that Scottsdale’s premium positioning is substantive and deliberate, not incidental.
Active listings in Greater Phoenix totaled 24,358 at end of January 2026 up 9.63% year-over-year per ARMLS providing Seattle buyers meaningful inventory options without the bidding dynamics of 2021–2022.
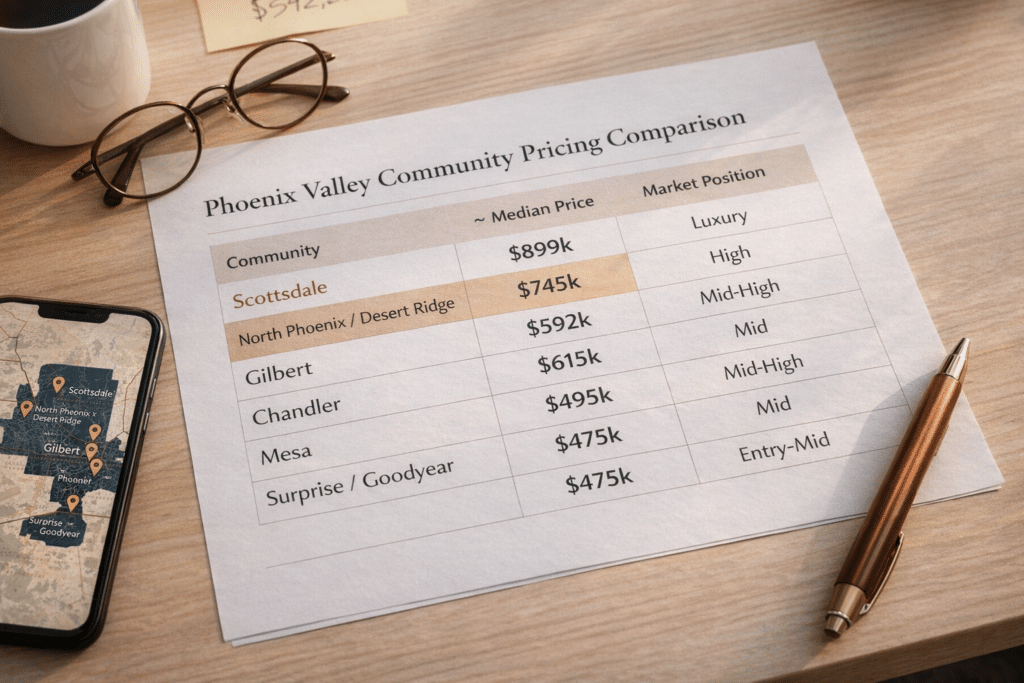
| Community | Approx. Median Price | Position |
|---|---|---|
| Scottsdale | ~$900,000–$995,000 | Premium — Valley's highest median; out-of-state buyer concentration high |
| North Phoenix / Desert Ridge | ~$550,000–$700,000 | Mid-premium; new construction heavy; strong HOA stock |
| Gilbert | ~$580,000–$592,000 | Southeast Valley master-planned; material equity gap vs. Seattle |
| Chandler | ~$540,000 | Tech corridor access; balanced resale and new-build inventory |
| Mesa | ~$490,000 | Broadest inventory range; lower entry point |
| Surprise / Goodyear | ~$430,000 | Maximum sq ft per dollar |
Source: ARMLS, Scottsdale REALTORS, Phoenix REALTORS, YTD 2025.
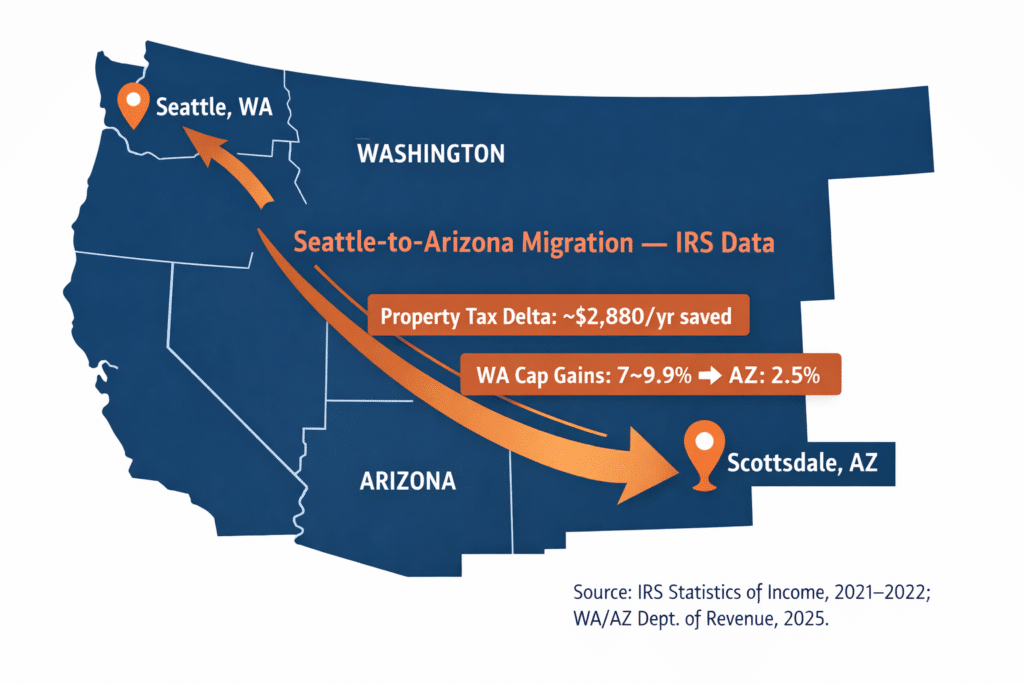
The University of Arizona’s Eller College of Management, in its analysis of IRS Statistics of Income migration data, specifically identifies Seattle as one of the documented metropolitan regions contributing domestic migration inflows to Arizona. IRS state-to-state migration data (2021-2022, the most recent complete dataset) confirms Washington among the top origin states for Arizona inbound migration across multiple income brackets.
Tax Foundation analysis of IRS migration data identifies Arizona among the top destinations for households with $200,000 or more in adjusted gross income a profile that maps directly onto the King County homeownership class, where home values and household incomes are among the highest in the Pacific Northwest.
Allied Van Lines’ 2025 U.S. Migration Report independently confirms Seattle among the metro areas generating the most outbound moves nationally, alongside Los Angeles, San Diego, and Chicago all of which are Hub 1’s primary origin markets.
For Seattle homeowners who have monitored this pattern but have not yet modeled their own transaction, the data suggests that the financial logic is not idiosyncratic. It is systematic and income-correlated: the households most likely to find the Seattle-to-Scottsdale math compelling are precisely those with the equity positions to execute it.
confirms Washington among the top origin states for Arizona inbound migration across $100,000–$200,000+ household income brackets.
Source: IRS Statistics of Income, State-to-State Migration Data, 2021-2022; Tax Foundation analysis, 2024.