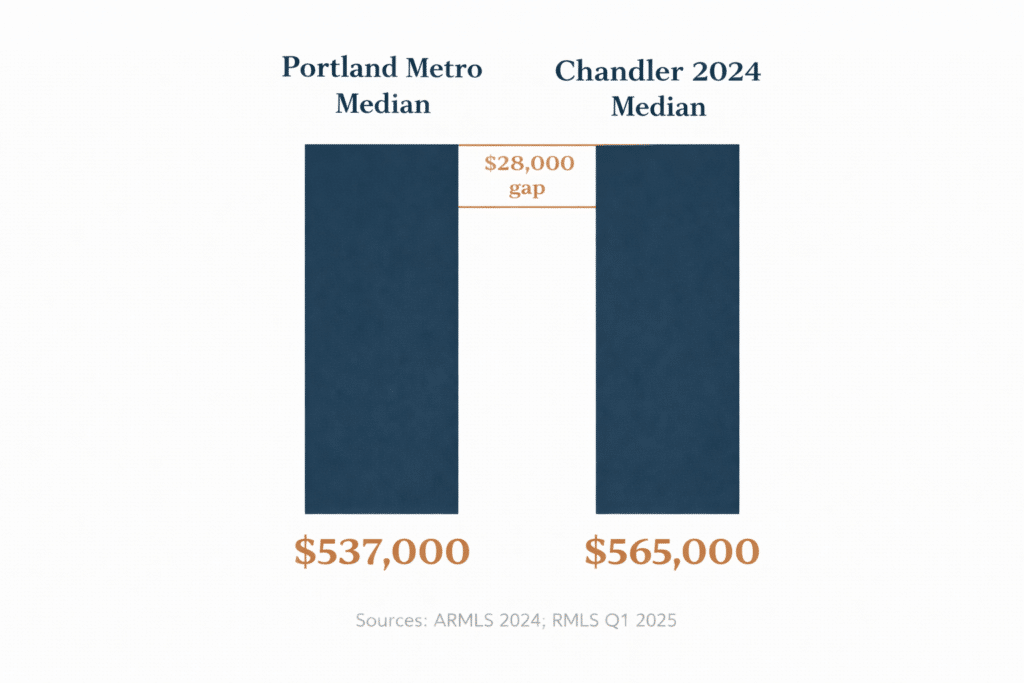
Chandler’s 2024 full-year median sold price of $565,000 sits just $28,000 above Portland’s metro median. For Portland homeowners carrying even modest equity, that gap closes with a standard down payment — and positions a Chandler purchase at or above the city median on day one. This page runs the equity math, maps the price tiers, and quantifies the property tax and income tax advantage of Arizona’s second-largest East Valley city.
The median price differential between Portland and Chandler is the smallest of any primary Phoenix Valley destination market. At $565,000 for Chandler and approximately $537,000 for the Portland metro — a spread of $28,000 — a Portland homeowner with as little as $113,000 in net proceeds can place a 20% down payment on a Chandler home at or above the city’s median price.
That threshold is meaningful because of what it implies about which Portland homeowners can access the Chandler market. It is not limited to long-term owners or above-median sellers. A Portland homeowner who purchased in 2019 at $425,000, made a 5–10% down payment, and has been making standard payments for five years likely holds enough equity to clear the $113,000 minimum and land at or above Chandler’s median. That is a materially different equity requirement than the $227,000 needed for a 20% down on Scottsdale’s $1,135,000 median.
The strategic implication: Chandler is the accessible entry point — the market where the fewest Portland equity positions are excluded and where the most Portland sellers can immediately access above-median inventory.
For Portland homeowners with larger equity positions — $200,000 to $400,000 in net proceeds — Chandler’s $700,000–$1,000,000 tier delivers 2,333 to 3,333 square feet at the 2024 average of $300 per square foot, in many cases within well-established master-planned communities with documented HOA amenity infrastructure.
Median price gap between Portland metro (~$537K) and Chandler ($565K)
SOURCE: ARMLS 2024 annual data; RMLS Q1 2025
Minimum 20% down payment at Chandler’s 2024 median
SOURCE: 20% × $565,000; ARMLS 2024
Chandler 2024 average days on market fastest of the three East Valley destination markets on this site
SOURCE: ARMLS 2024 annual data (via FlexMLS)
Source: ARMLS 2024 Annual Data (via FlexMLS)
The table below maps representative Portland equity positions to Chandler purchase price ranges at 20% down. The top row — the minimum equity needed to reach Chandler’s median — is the lowest threshold of any destination guide in the Portland silo, which is the defining financial characteristic of this market for Portland buyers.
Net proceeds estimated at 94% of sale price after commissions, closing costs, and prorations. Mortgage balance estimates are representative and depend on original loan terms, purchase year, and prepayment history. Consult your listing agent for a property-specific net sheet.

| Portland Net Proceeds (Estimated) | Down Payment (20%) | Chandler Purchase Price (Approx.) | Chandler Market Tier |
|---|---|---|---|
| ~$113,000–$140,000 | 20% | $565,000–$700,000 | At / above median |
| ~$140,000–$180,000 | 20% | $700,000–$900,000 | Mid-tier |
| ~$180,000–$240,000 | 20% | $900,000–$1,200,000 | Upper-mid |
| ~$240,000–$320,000 | 20% | $1,200,000–$1,600,000 | Premium tier |
| ~$320,000–$400,000 | 20% | $1,600,000–$2,000,000 | Luxury tier |
| Cash / large equity position | varies | $400,000–$565,000 | Below median, high mortgage reduction |
Portland homeowners with full cash equity or very large down payment positions who choose to enter Chandler below the median — at $400,000–$565,000 — are making a deliberate tradeoff: lower purchase price, smaller financed balance, and lower monthly carrying cost in exchange for a smaller home or older housing stock. This is a valid financial posture, not a compromise. Chandler’s $400,000–$565,000 tier still delivers approximately 1,333–1,883 square feet at the city’s average price per square foot — typically in established neighborhoods with direct Loop 202 employment corridor access.
Chandler spans approximately 65 square miles across a fully built-out urban grid in the southeastern Phoenix metro. Unlike Gilbert, which still has active development in its outer quadrants, and North Scottsdale, which has significant new construction, Chandler is largely built out. Resale inventory dominates across all price tiers. This has two financial consequences for Portland buyers: less competition from new construction buyers, and a more stable pricing environment with less speculative volatility from builder incentives.
PRICE RANGE: $400,000–$565,000
TYPICAL SQ FT: 1,200–1,900 sq ft LOT SIZE: 4,000–7,000 sq ft (established grid)
YEAR BUILT RANGE: 1985–2005 (older established housing stock; many updated kitchens and mechanical systems common in this tier)
DOM (2024): ~48 days citywide average (ARMLS 2024)
PROPERTY TAX EST. AT $482,500 MIDPOINT: ~$2,509/year at 0.52% effective rate (Maricopa County Treasurer)
PORTLAND EQUITY NEEDED FOR 20% DOWN: ~$97,000 at $482,500 price midpoint
HOA PRESENCE: Variable — some established HOA-governed communities; many older grid neighborhoods without HOA governance
EMPLOYMENT CORRIDOR PROXIMITY: Direct access to Loop 202 / Price Corridor (Intel Ocotillo, Microchip Technology, PayPal, Wells Fargo operations) and to US-60 connection to Gilbert, Mesa, and Tempe employment nodes
PRICE RANGE: $565,000–$850,000
TYPICAL SQ FT: 1,850–2,850 sq ft LOT SIZE: 6,000–10,000 sq ft; mix of HOA-governed and non-HOA
YEAR BUILT RANGE: 1995–2015; newer construction mixed into the tier DOM (2024): ~48 days citywide average (ARMLS 2024)
PROPERTY TAX EST. AT $707,500 MIDPOINT: ~$3,679/year at 0.52% effective rate (Maricopa County Treasurer)
PORTLAND EQUITY NEEDED FOR 20% DOWN: ~$141,500 at $707,500 price midpoint — accessible to Portland homeowners with a 2016 or earlier purchase date and standard equity accumulation
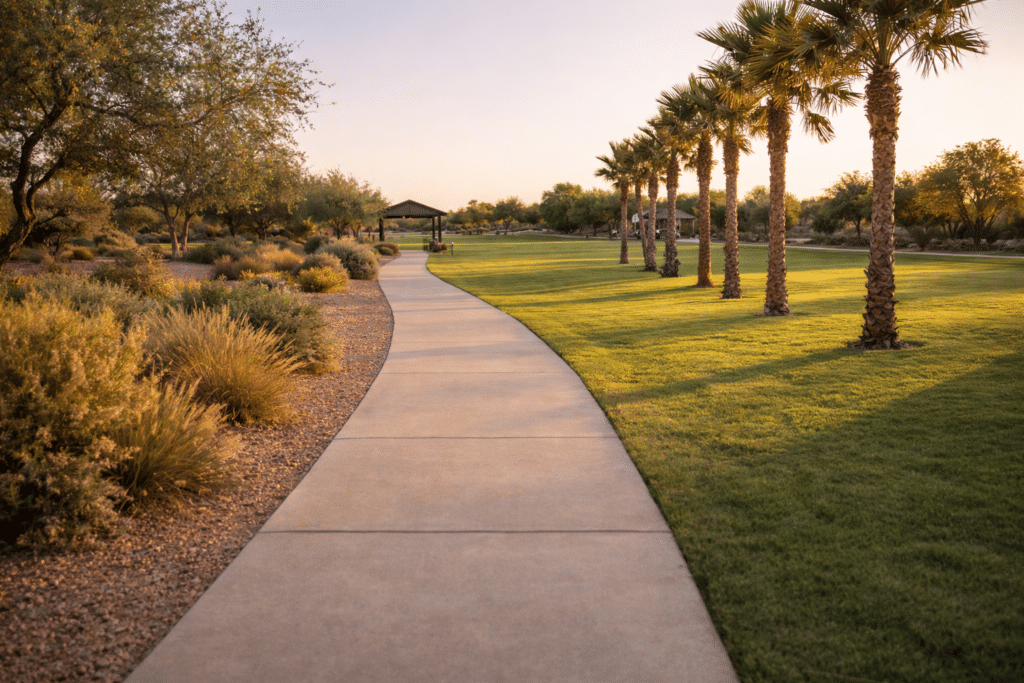
HOA PRESENCE: More prevalent at this tier; HOA-governed communities with documented common amenities — pools, parks, walking trails, greenbelt corridors — are common in Chandler’s mid-1990s through 2010 master-planned developments
EMPLOYMENT CORRIDOR PROXIMITY: Same Loop 202 / Price Corridor access; approximately 20–30 minutes to Scottsdale Airpark via Loop 101; 15–25 minutes to Phoenix Sky Harbor International Airport via Loop 202
PRICE RANGE: $850,000–$2,000,000+
TYPICAL SQ FT: 2,800–5,500+ sq ft LOT SIZE: 9,000–20,000+ sq ft; some custom and semi-custom lots in premium Chandler sub-markets
YEAR BUILT RANGE: 2000–present; mix of established luxury resale and newer semi-custom construction
DOM (2024): Near citywide average of 48 days; luxury segment may vary PROPERTY TAX EST. AT $1,425,000 MIDPOINT: ~$7,410/year at 0.52% effective rate (Maricopa County Treasurer)
PORTLAND EQUITY NEEDED FOR 20% DOWN: ~$285,000 at $1,425,000 price midpoint
HOA PRESENCE: Prevalent; established master-planned communities at this tier typically include documented amenity packages: multiple pool nodes, extensive trail systems, gated access in some communities, and active Architectural Review Committees
EMPLOYMENT CORRIDOR PROXIMITY: Same as lower tiers; premium Chandler sub-markets along Price Road corridor, Dobson Road, and the Ocotillo area offer direct employment infrastructure access
At Chandler’s 2024 average of $300 per square foot, the conversion from purchase price to physical space is straightforward. At comparable dollar amounts, Chandler and Portland deliver similar raw square footage numbers at the lower price tiers. The financial advantage is not primarily in the square footage column — it is in three other factors: construction vintage, lot size, and the income and property tax structure that governs carrying costs from day one of ownership.
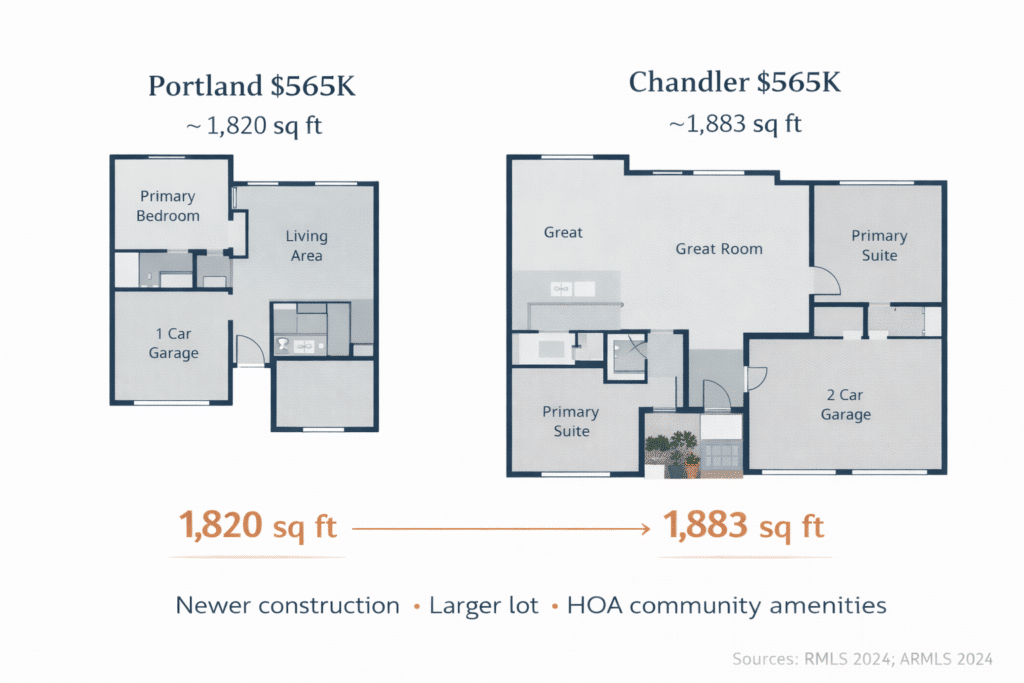
| Purchase Price | Portland Typical Sq Ft (at ~$265–$310/sq ft)* | Chandler Typical Sq Ft (at $300/sq ft avg)** |
|---|---|---|
| $450,000 | ~1,450–1,700 sq ft | ~1,500 sq ft |
| $550,000 | ~1,775–2,075 sq ft | ~1,833 sq ft |
| $650,000 | ~2,095–2,455 sq ft | ~2,167 sq ft |
| $750,000 | ~2,420–2,830 sq ft | ~2,500 sq ft |
| $900,000 | ~2,900–3,400 sq ft | ~3,000 sq ft |
| $1,000,000 | ~3,225–3,775 sq ft | ~3,333 sq ft |
Portland sq ft range based on RMLS 2024 market data patterns. Range reflects variation across sub-markets within the Portland metro area.
Chandler sq ft calculated at 2024 ARMLS average of $300/sq ft applied uniformly to stated price points. Individual properties vary by sub-market, vintage, and condition.
WHAT THE TABLE SHOWS:
At comparable prices, the raw square footage is similar. This is the honest version of the data — and it deserves an honest interpretation.
In Portland at $565,000: A typical home built between 1955 and 1995 on a lot averaging 4,500–6,500 square feet. HOA governance is largely absent. Community pool or trail infrastructure requires separate membership fees or is not available.
In Chandler at $565,000: A home built primarily between 1990 and 2010 in an established East Valley community. At this price tier, a portion of available inventory includes properties within HOA-governed communities with documented common amenity access — pools, trails, parks — included in the HOA monthly fee. Lot sizes in comparable Chandler inventory average 6,000–8,000 square feet, frequently larger than Portland equivalents.
The financial case for Chandler is not built on square footage alone. It is built on construction vintage, property tax differential, income tax differential, and the total 10-year ownership cost that flows from paying Oregon’s combined income tax burden instead of Arizona’s 2.5% flat rate for each of those years.
Oregon’s statewide average effective property tax rate is approximately 0.78% of market value (Tax Foundation; Kiplinger Oregon Tax Guide, 2024). Maricopa County — which encompasses all of Chandler — carries a median effective rate of approximately 0.52% (Maricopa County Treasurer; Ownwell, 2024). On a home at Chandler’s 2024 median of $565,000, the annual property tax differential between the two states is approximately $1,469.
That figure may not appear decisive in isolation. But added to the income tax differential — detailed in Section 10 — the combined annual financial advantage of Arizona residency at a $150,000 household income exceeds $10,000 per year. The property tax savings represent a reliable, recurring component of that total.
Estimated annual property tax savings (AZ vs. OR) at Chandler’s 2024 median price of $565,000 SOURCE: Maricopa County Treasurer; Tax Foundation Oregon Profile, 2024
10-year cumulative savings at the same property value: ~$14,690 before accounting for income tax reduction or equity appreciation.

| Home Price | OR Effective Rate (~0.78%) | AZ Effective Rate (~0.52%) | Annual Tax Savings in Arizona |
|---|---|---|---|
| $450,000 | ~$3,510/year | ~$2,340/year | ~$1,170/year |
| $565,000 | ~$4,407/year | ~$2,938/year | ~$1,469/year |
| $650,000 | ~$5,070/year | ~$3,380/year | ~$1,690/year |
| $750,000 | ~$5,850/year | ~$3,900/year | ~$1,950/year |
| $900,000 | ~$7,020/year | ~$4,680/year | ~$2,340/year |
| $1,000,000 | ~$7,800/year | ~$5,200/year | ~$2,600/year |
Source: Maricopa County Treasurer (AZ effective rate ~0.52%); Tax Foundation / Kiplinger Oregon Tax Guide (OR effective rate ~0.78%, 2024). Rates expressed as percentage of market value. Individual assessed values may differ from market value; consult Maricopa County Assessor for property-specific data.
The property tax differential matters. The income tax differential changes the financial picture entirely.
Portland-area residents face a three-layer earned-income tax structure:
Layer 1 — Oregon state income tax: 4.75% to 9.9%, reaching the top bracket at $125,000 single / $250,000 joint (Tax Foundation, 2025 rates).
Layer 2 — Multnomah County income tax: 1.5% to 3%, applied above $125,000 single / $200,000 joint (Tax Foundation, 2026 State Tax Competitiveness Index).
Layer 3 — Metro Supportive Housing Services tax: 1% flat, applied above $125,000 single / $200,000 joint (Tax Foundation, 2026).
Combined top rate for a Portland-area household at upper-middle income: up to 13.9% — the highest combined local income tax in the nation per the Tax Foundation’s 2026 State Tax Competitiveness Index.
Arizona’s flat income tax rate: 2.5%. No county surcharge. No metro-level income tax.
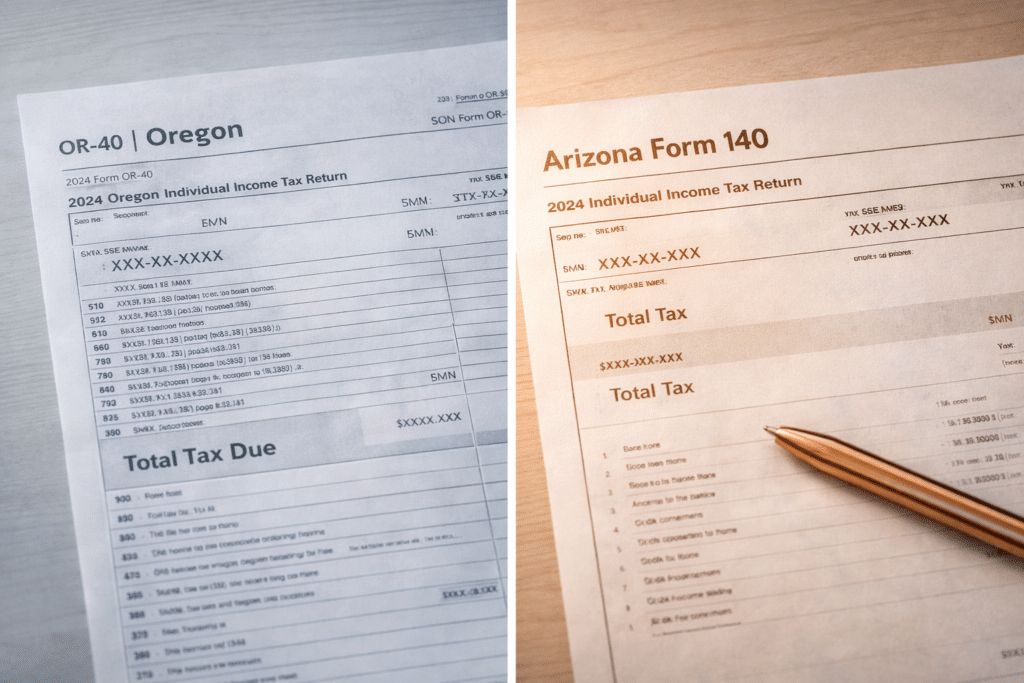
Oregon combined rate (estimated blended, ~$150K income): ~$11,400–$12,500
Arizona flat rate (2.5% of $150,000): ~$3,750 Estimated annual income tax savings in Arizona: ~$7,650–$8,750
Added to property tax savings at Chandler’s median (~$1,469/year): Combined annual financial advantage: approximately $9,120–$10,220 per year for a representative $150,000 household purchasing at Chandler’s 2024 median.
IMPORTANT: These estimates use representative blended effective rates and are illustrative only. Individual tax liability depends on filing status, deductions, credits, other income sources, and applicable exemptions. Consult a licensed tax professional for household-specific projections.
Chandler’s HOA landscape is more variable than Gilbert’s or North Scottsdale’s because the city spans four decades of development with significantly different HOA governance structures across its sub-markets.
In Chandler’s older grid neighborhoods — primarily 1985 to 1998 vintage — HOA governance is frequently absent or minimal. Monthly fees are $0 or under $100, and common amenity infrastructure is limited to basic CC&R enforcement if an HOA exists at all. For Portland homeowners who prefer to avoid HOA governance, Chandler’s older-grid inventory provides that option.
In Chandler’s master-planned communities built from approximately 1998 through 2015 — which dominate the $500,000–$800,000 tier — HOA governance is standard. Monthly fees in these communities typically range from approximately $75 to $225, covering some combination of community pool maintenance, park and greenbelt maintenance, walking trail upkeep, and common area landscaping. CC&Rs are actively enforced by Architectural Review Committees in most of these communities.
In Chandler’s premium and upper-mid tier communities — primarily $850,000+ — HOA fees commonly reach $200 to $400+ per month, reflecting more extensive amenity packages: multiple pool nodes, gated access in some communities, clubhouse facilities, and larger maintained common areas.
At the Chandler median price, the total monthly PITI (without HOA) is approximately $100 per month lower than an equivalent Portland home — driven entirely by the property tax differential. With a mid-range HOA fee, the Chandler carrying cost is comparable to or modestly above Portland at the same price. The income tax savings — approximately $7,650–$8,750 per year at $150,000 household income — are realized separately, as a reduction in total annual tax liability, not as a reduction in monthly mortgage payments.
IMPORTANT: Illustrative estimates only. Mortgage payments depend on rate, credit profile, and loan structure. Insurance costs depend on coverage and carrier. HOA fees depend on the specific community; verify before purchase. Interest rate assumption: 6.75% (for illustrative purposes; actual rates vary by lender, credit score, and loan type).
Chandler’s 2024 full-year ARMLS data tells a specific story that is relevant to Portland homeowners evaluating their timing. The median sold price of $565,000 represents a 4.2% increase from 2023 — moderate appreciation, not exponential. The 2024 days on market of 48 was the lowest of any primary East Valley destination market covered on this site, and lower than Chandler’s own 2023 figure of 53 days. Chandler moved faster in 2024.
That market pace reflects fundamental demand — not speculative overheating — in a city that is largely built out, where new supply is limited, and where the employment infrastructure of the Price Corridor continues to generate sustained household demand. For Portland sellers who worry about a destination market where inventory sits and prices soften, the 2024 Chandler data does not present that picture.

| Metric | Value / Source |
|---|---|
| 2024 Median Sold Price (single-family) | $565,000 (ARMLS, 2024 annual) |
| 2024 Average Sold Price (single-family) | $647,597 (ARMLS, 2024 annual) |
| 2024 Avg. Sold Price per Sq Ft | $300/sq ft (ARMLS, 2024) |
| 2024 Total Units Sold (single-family) | 2,308 homes (ARMLS, 2024) |
| YoY Median Price Change (2023→2024) | +4.2% ($542,250→$565,000, ARMLS) |
| YoY Avg. Price per Sq Ft Change | +4.5% ($287→$300, ARMLS, 2024) |
| 2024 Days on Market | 48 days (ARMLS, 2024 — full year) |
| 2025 Full-Year Median (where available) | $565,000 (ARMLS full-year 2025; flat vs. 2024) |
| Maricopa County Eff. Property Tax Rate | ~0.52% (Maricopa County Treasurer) |
| Build-Out Status | Largely built out; resale-dominant |
| HOA Presence | Prevalent in master-planned communities; absent in older grid neighborhoods |
Source: ARMLS transaction data via SWEE Phoenix Homes / FlexMLS system (2024 annual and 2025 full-year update); Maricopa County Treasurer; Ownwell Maricopa County analysis, 2024.
The 2025 full-year median of $565,000 — flat versus 2024 — reflects a stabilization pattern visible across the broader Phoenix Valley as inventory expanded and days on market extended in 2025. For Portland buyers, flat price appreciation in a destination market is not a negative signal. It means the entry window has not closed, and the income tax and property tax financial advantages of Arizona residency begin accruing from the first year of ownership regardless of what the price does in year two.
Portland homeowners evaluating the long-term financial stability of a Chandler purchase — not just the entry economics — benefit from understanding the demand infrastructure that underlies the market. Sustained demand is the mechanism by which home equity grows after a purchase.
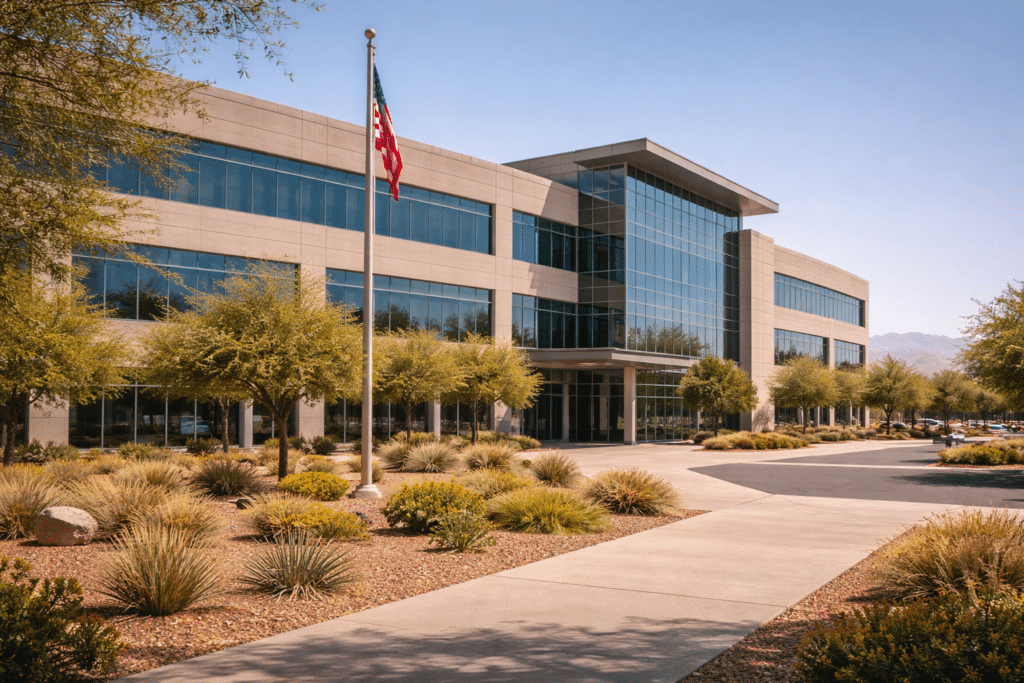
Chandler’s Price Corridor (Loop 202 / Price Road axis) is one of the Phoenix Valley’s densest concentrations of large-employer operations. Documented large employers with significant Chandler operations include: Intel Corporation (Ocotillo campus), Microchip Technology (global headquarters), PayPal (operations center), Wells Fargo (operational campus), Bank of America (operations), and Northrop Grumman (operations). These employers represent durable, capital-intensive employment infrastructure — not transient commercial operations.
For Portland homeowners, the financial relevance is this: a destination market with diversified, institutional employment infrastructure tends to maintain housing demand through economic cycles more reliably than markets dependent on a single sector or employer. That is a long-term equity preservation argument, not a short-term pricing argument.
For Portland homeowners evaluating multiple East Valley destinations, the table below places Chandler’s key 2024 metrics alongside Gilbert and Scottsdale.
| Market | 2024 Median Sold Price | Avg. Price per Sq Ft | 2024 Avg. DOM |
|---|---|---|---|
| Chandler | $565,000 | $300/sq ft | 48 days |
| Gilbert | $601,750 | $293/sq ft | ~60–65 days |
| Scottsdale | $1,135,000 | $481/sq ft | 79 days |

Our brokerage partner, West USA Realty, represents buyers relocating to Gilbert, Chandler, Scottsdale, and all Phoenix Valley communities. Connect directly with a licensed Arizona agent at westusa.net.
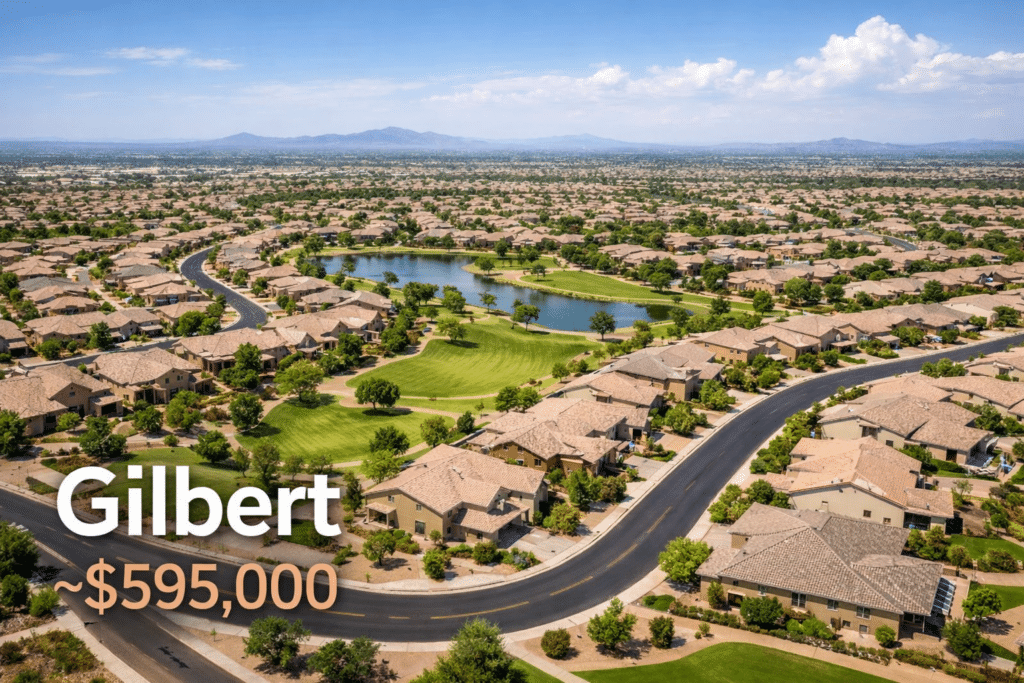
Gilbert 2024 MEDIAN: $601,750
AVG. PRICE/SQ FT: $293/sq ft 20%
DOWN AT MEDIAN: ~$120,000
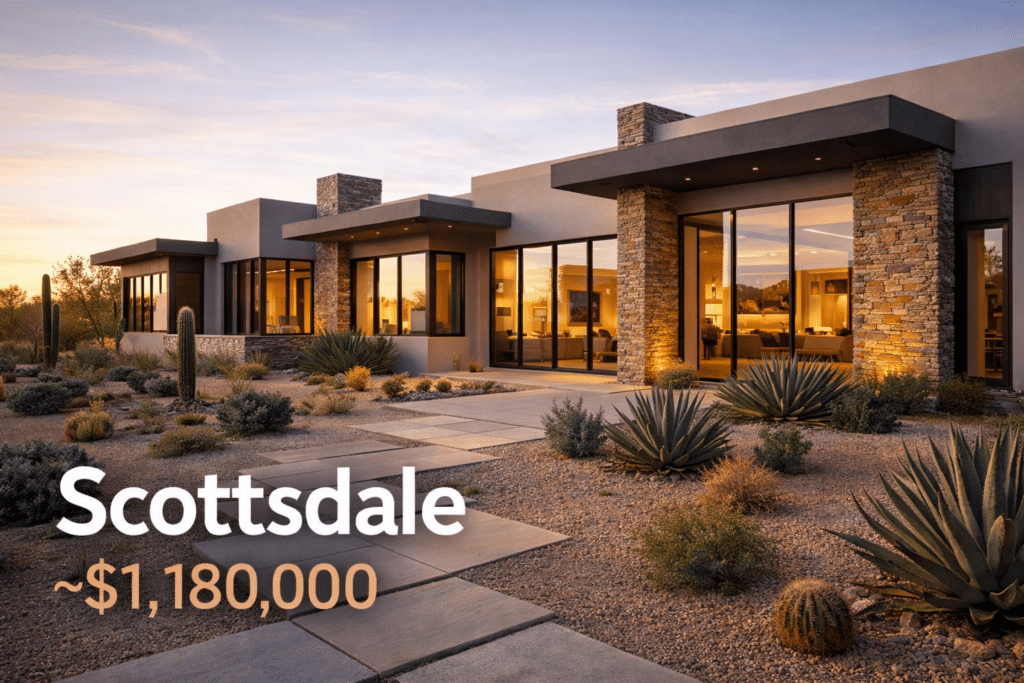
Scottsdale 2024 MEDIAN: $1,135,000
AVG. PRICE/SQ FT: $481/sq ft 20%
DOWN AT MEDIAN: ~$227,000
A: The 2024 full-year median sold price for single-family homes in Chandler was $565,000 — a 4.2% increase from 2023’s median of $542,250 — according to ARMLS transaction data. The average sold price per square foot in 2024 was $300/sq ft. The 2024 median held flat into 2025, with the full-year 2025 figure also reported at $565,000.
A: Chandler’s $565,000 median sits just $28,000 above Portland’s metro median of approximately $537,000. A Portland homeowner with as little as $113,000 in net proceeds can make a 20% down payment at or above Chandler’s median. At $300/sq ft, that median price accesses approximately 1,883 square feet. Portland homeowners with $180,000–$240,000 in proceeds can access the $900,000–$1,200,000 upper-mid tier, where $300/sq ft delivers approximately 3,000–4,000 square feet.
A: Of the three primary East Valley destination markets covered on this site, Chandler has the lowest 2024 median at $565,000 (vs. Gilbert’s $601,750 and Scottsdale’s $1,135,000) and the fastest 2024 days on market at 48 days. At $300/sq ft, Chandler sits between Gilbert ($293/sq ft) and Scottsdale ($481/sq ft), making it the most accessible entry point for Portland sellers with smaller equity positions. All three markets share Maricopa County’s 0.52% effective property tax rate.
A: Chandler is within Maricopa County, where the median effective property tax rate is approximately 0.52% of market value (Maricopa County Treasurer; Ownwell, 2024). On Chandler’s 2024 median price of $565,000, the estimated annual property tax is approximately $2,938. Oregon’s statewide average effective rate of 0.78% produces an estimated bill of approximately $4,407 on the same value — a difference of roughly $1,469 per year in Arizona’s favor.