Most California homeowners know their property tax bill is capped by Proposition 13. Fewer have calculated what happens the moment they sell. When that transaction closes, Prop 13’s assessed value protections vanish permanently. The next property wherever it is gets assessed at full purchase price. This guide maps what that reassessment looks like across California origin counties versus Maricopa County, Arizona, and quantifies the annual and cumulative gap.
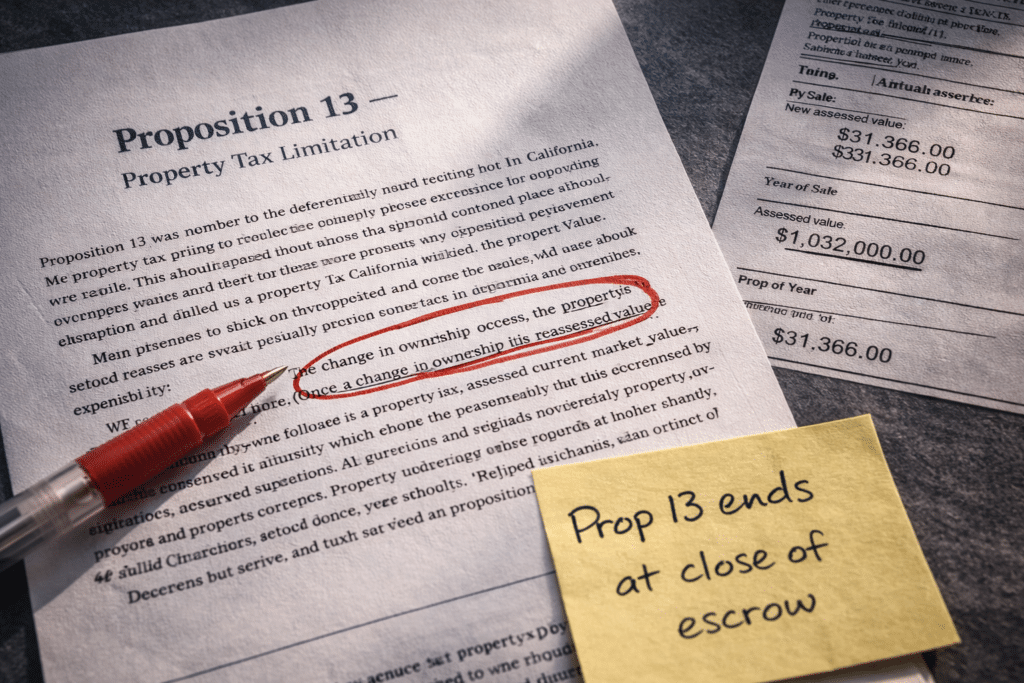
Proposition 13 (1978) sets California’s framework: when a property changes hands, it is assessed at the purchase price, and future assessed-value increases are capped at 2% per year regardless of market appreciation. For a homeowner who bought in 2005 at $600,000 and now owns a home worth $1,100,000, Prop 13 has been a material protection — the assessed value grew slowly even as the market moved sharply higher.
But Prop 13 is property-specific, not person-specific. It does not transfer. The moment you close a sale, the Prop 13 protection ends on that parcel. Your next property — whether in California, Arizona, or elsewhere — begins at a fresh baseline: assessed at the new purchase price. Prop 13’s cap applies only to future increases from that new baseline (and only in California).
This is the common comparison error: homeowners compare their current, Prop 13-protected California bill against an Arizona bill. That overstates the “California side” advantage because the seller is not staying in the same property. The correct comparison is:
Not: your current Prop 13-protected California bill vs. Arizona.
But: a new California purchase at today’s prices vs. a Maricopa County purchase at Arizona prices.
When you sell, your Prop 13 shield disappears. Your next property is assessed at its purchase price — in any state.
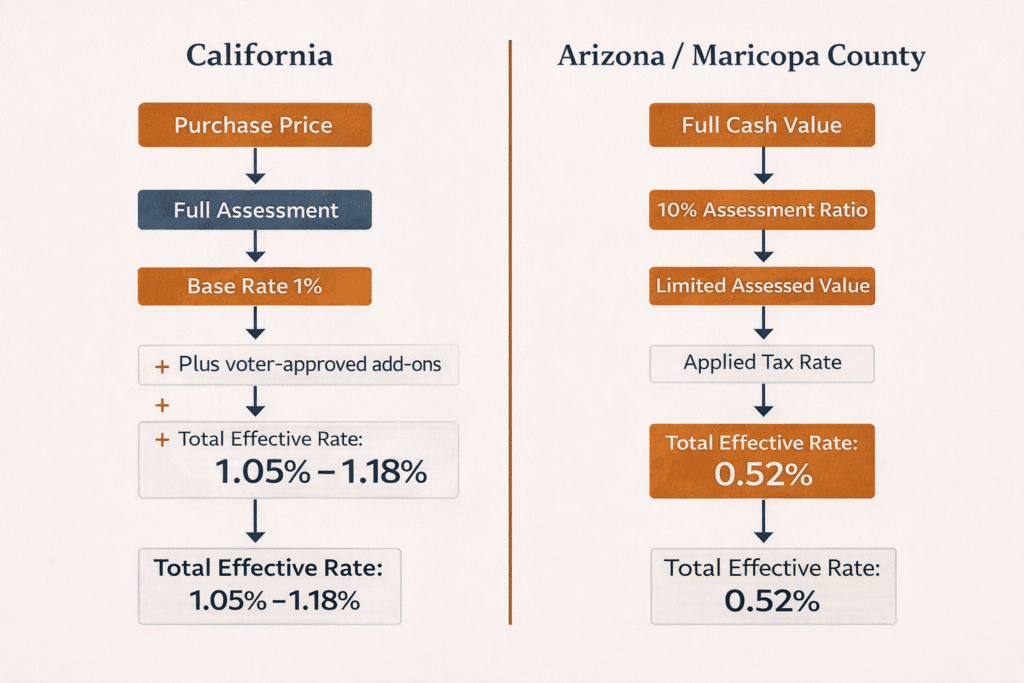
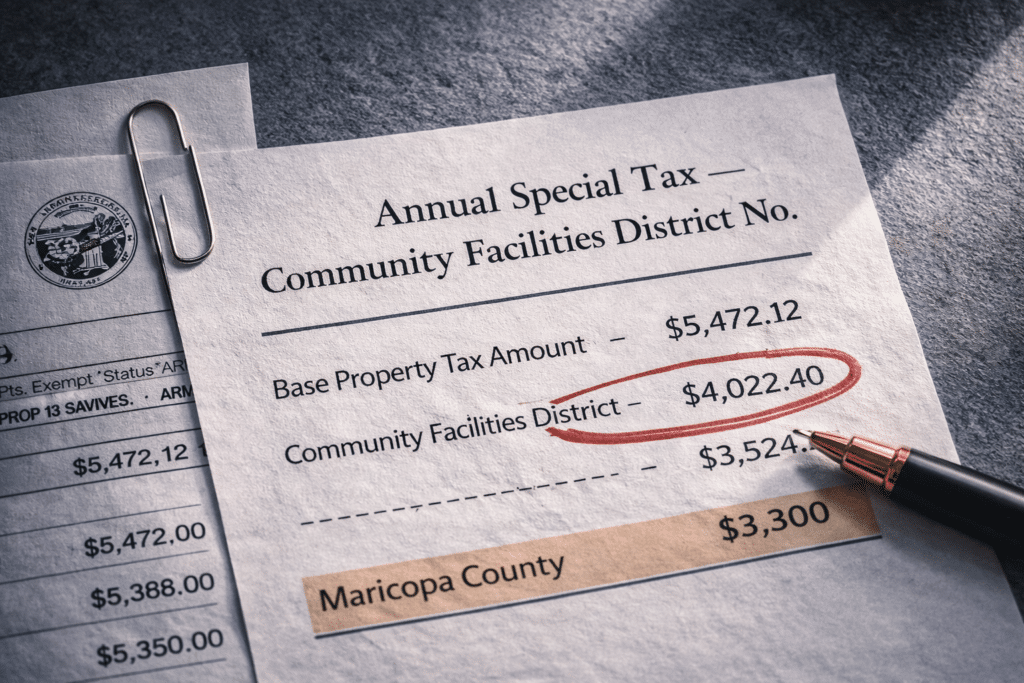
California’s starting point is Prop 13’s 1% base rate applied to assessed value. In practice, local districts add voter-approved charges: bond measures, infrastructure levies, special assessments, and community facilities district fees (often called Mello-Roos in newer developments). As a result, effective rates (actual tax bill as a percentage of purchase price) typically exceed 1% in major counties.
County effective rates used in this guide (Abode Money 2025 analysis):
~1.16%
~1.16%
~1.08%
~1.18%
~1.10%
~1.05%
~1.09%
Arizona uses a different method. County assessors establish a Full Cash Value (FCV) roughly aligned to market value. Residential property is then assessed using a statutory ratio (commonly framed as ~10% for owner-occupied residential for simplified planning), and taxing jurisdictions apply rates to assessed value.
For planning purposes, what matters is the effective property tax rate (tax as a percentage of market value). In practice, Maricopa County’s median effective rate is approximately 0.52% (Maricopa County Treasurer / commonly cited analyses). On a $500,000 purchase, that models near $2,600/year. The primary tax rate for fiscal year 2025 is cited at $1.16 per $100 of assessed value, with a declining multi-year trend.
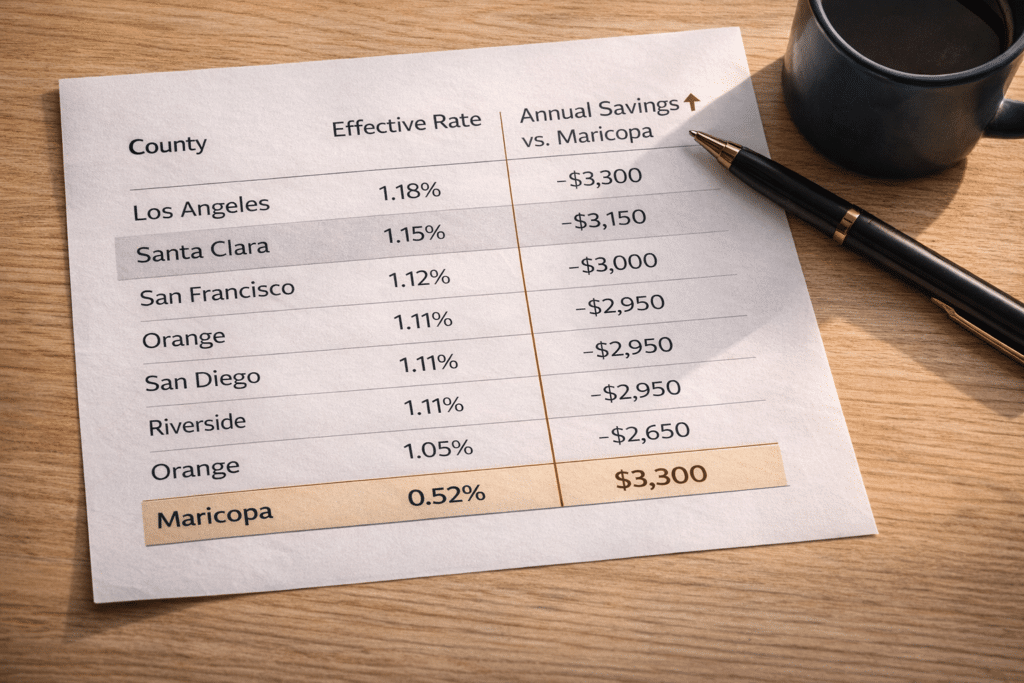
The tables below apply effective rates to benchmark purchase prices ($500,000, $700,000, $1,000,000). These reflect new-purchase assessments — the relevant comparison for a seller exiting a California property and buying again.
| County | Eff. Rate | Annual Tax Bill | vs. Maricopa Annual Savings |
|---|---|---|---|
| Los Angeles County | 1.16% | ~$5,800 | ~$3,200 |
| Santa Clara County | 1.16% | ~$5,800 | ~$3,200 |
| San Francisco County | 1.18% | ~$5,900 | ~$3,300 |
| San Diego County | 1.08% | ~$5,400 | ~$2,800 |
| Orange County | 1.05% | ~$5,250 | ~$2,650 |
| Riverside County | 1.10% | ~$5,500 | ~$2,900 |
| San Bernardino County | 1.09% | ~$5,450 | ~$2,850 |
| Maricopa County, AZ | 0.52% | ~$2,600 | — |
| County | Eff. Rate | Annual Tax Bill | vs. Maricopa Annual Savings |
|---|---|---|---|
| Los Angeles County | 1.16% | ~$8,120 | ~$4,480 |
| Santa Clara County | 1.16% | ~$8,120 | ~$4,480 |
| San Francisco County | 1.18% | ~$8,260 | ~$4,620 |
| San Diego County | 1.08% | ~$7,560 | ~$3,920 |
| Orange County | 1.05% | ~$7,350 | ~$3,710 |
| Riverside County | 1.10% | ~$7,700 | ~$4,060 |
| San Bernardino County | 1.09% | ~$7,630 | ~$3,990 |
| Maricopa County, AZ | 0.52% | ~$3,640 | — |
| County | Eff. Rate | Annual Tax Bill | vs. Maricopa Annual Savings |
|---|---|---|---|
| Los Angeles County | 1.16% | ~$11,600 | ~$6,400 |
| Santa Clara County | 1.16% | ~$11,600 | ~$6,400 |
| San Francisco County | 1.18% | ~$11,800 | ~$6,600 |
| San Diego County | 1.08% | ~$10,800 | ~$5,600 |
| Orange County | 1.05% | ~$10,500 | ~$5,300 |
| Riverside County | 1.10% | ~$11,000 | ~$5,800 |
| San Bernardino County | 1.09% | ~$10,900 | ~$5,700 |
| Maricopa County, AZ | 0.52% | ~$5,200 | — |
Sources: Abode Money 2025 California County Property Tax Trends (effective rates); Maricopa County Treasurer (effective rate references). Figures are estimates. Parcel-level tax bills vary by special districts, exemptions, and jurisdiction.
County effective rates are blended averages. They can understate real-world burdens on newer California construction, where Community Facilities District (CFD) assessments — commonly called Mello-Roos — add an additional annual line item to fund infrastructure (roads, parks, utilities, and related improvements). In high-growth regions, CFD assessments can lift a property’s effective burden well above baseline averages. In parts of the Inland Empire, total effective burdens can reach ~1.55%+ on certain new-build parcels (as cited in Abode Money’s 2025 analysis and similar market summaries).
Arizona does not have a direct Mello-Roos equivalent in name. Special districts exist in Maricopa County and can add to totals, but the magnitude and frequency differ from California’s CFD pattern. The correct comparison for a seller already paying Mello-Roos is their actual total annual bill, not the 1% base rate.
Property tax savings are not one-time. They recur every year you own. The table below uses the $500,000 scenario annual savings and applies simple 10-year and 20-year multiples (illustrative only).
At $700,000 and $1,000,000 purchase prices, the savings scale proportionally. A buyer comparing a $700,000 new purchase in Maricopa County to a comparable California county can model roughly $44,000–$46,000 in 10-year savings from property tax alone, depending on county effective rate.
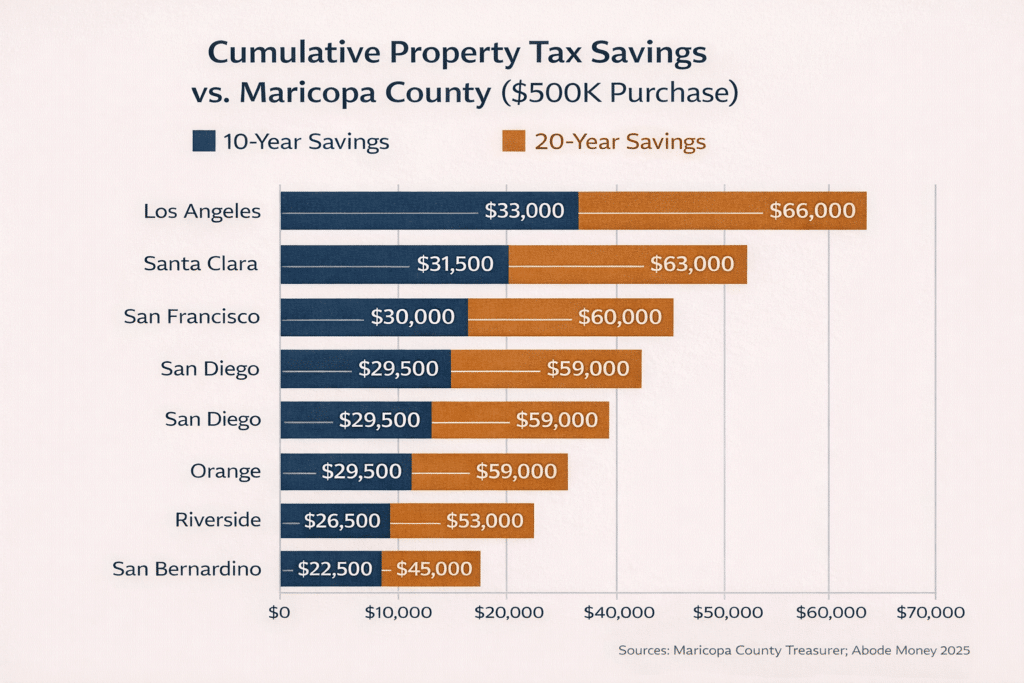
| CA Origin County | Annual Savings ($500K) | 10-Year Cumulative | 20-Year Cumulative |
|---|---|---|---|
| Los Angeles County | ~$3,200 | ~$32,000 | ~$64,000 |
| Santa Clara County | ~$3,200 | ~$32,000 | ~$64,000 |
| San Francisco County | ~$3,300 | ~$33,000 | ~$66,000 |
| San Diego County | ~$2,800 | ~$28,000 | ~$56,000 |
| Orange County | ~$2,650 | ~$26,500 | ~$53,000 |
| Riverside County | ~$2,900 | ~$29,000 | ~$58,000 |
| San Bernardino County | ~$2,850 | ~$28,500 | ~$57,000 |
Illustrative only. Actuals vary by parcel, future rate changes, exemptions, and assessed value rules.
Arizona limits property tax levy growth: the primary property tax levy for jurisdictions is capped at 5% annual growth, excluding new construction. This does not mirror Prop 13 (Arizona reassesses annually rather than fixing assessed value to purchase price), but it constrains revenue growth and moderates rate pressure.
Maricopa County’s primary property tax rate is cited as declining for four consecutive years through FY 2025, reaching $1.16 per $100 of assessed value. The median annual property tax bill in Maricopa County is cited around $1,766, below national median figures reported in common property tax summaries.
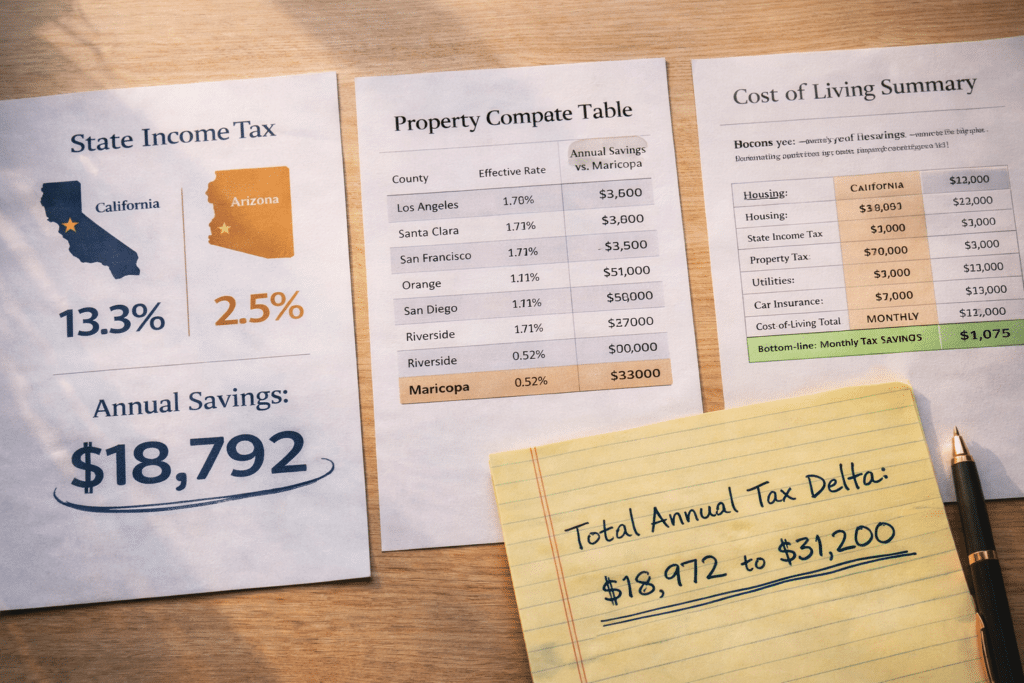
Property tax is meaningful — but for many households, state income tax is the larger annual lever. Arizona’s flat 2.5% rate versus California’s top marginal 13.3% (plus surcharge structure) can produce $15,000–$25,000+ in annual income tax savings for households earning $200,000–$300,000. The property tax savings documented here (often $2,600–$6,600/year depending on county and price) are additive.
Together, income tax delta + property tax delta + smaller sales tax differences can create total annual tax savings that commonly land in the high five figures over a multi-year holding period.