San Diego County’s median single-family home price crossed $1,000,000 in December 2025, according to the California Association of Realtors. Only 13% of San Diego County households could afford to purchase at that median in Q3 2025. Greater Phoenix sits at $450,000. The $550,000 spread between those two numbers is the equity event that sent 8,433 San Diego County residents to Arizona in a single IRS filing year the second-largest county-to-state migration corridor in the nation.
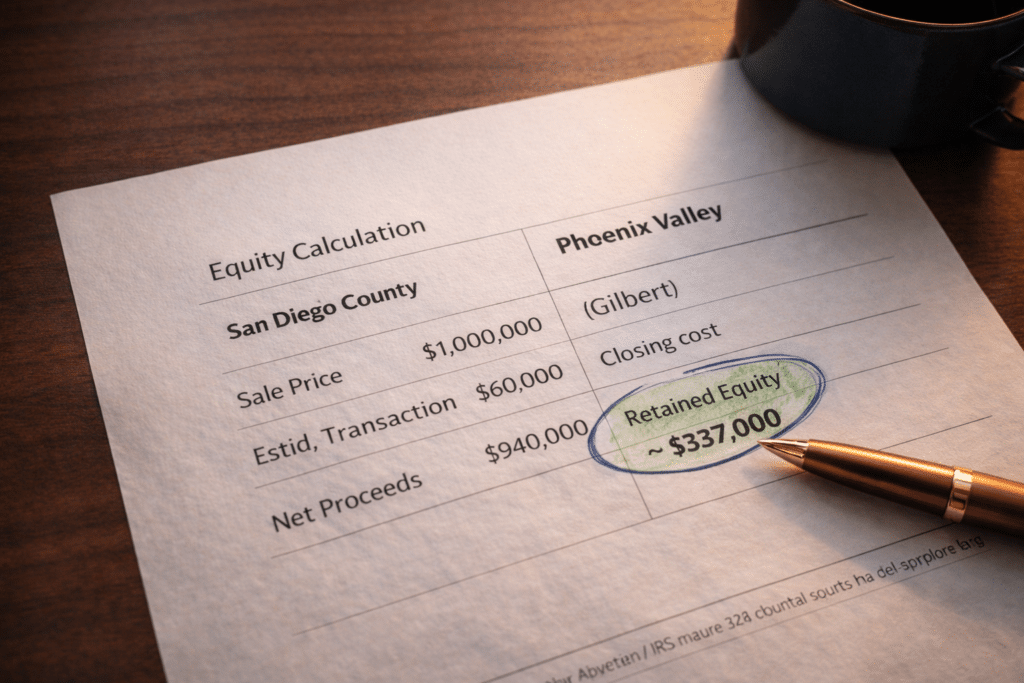
San Diego County’s median single-family home price crossed the $1M threshold and stayed there through year-end 2025. Per California Association of Realtors reporting, the December 2025 median was $1,000,000 a clean number with a clear implication: a homeowner selling at or above that median, purchasing at the Greater Phoenix median of $450,000, and accounting for standard transaction costs retains roughly $490,000 to $510,000 in net equity. That capital doesn’t vanish into a new mortgage. It remains liquid on the balance sheet available for debt payoff, investment, or reserves that often didn’t exist while equity was trapped inside a high-carry-cost San Diego property.
The migration data confirms that San Diego homeowners are running this math at scale. IRS Statistics of Income county-to-county migration data for the 2021–2022 filing year shows San Diego County sent 8,433 tax filers to Arizona, producing a net flow of +4,099 in Arizona’s favor. Put differently: for every two San Diego residents who moved to Arizona, roughly one moved back. The corridor is large, persistent, and structurally tilted one direction.
The equity case compounds when the income tax differential enters the equation. California’s top marginal income tax rate of 13.3% plus a 1.1% payroll surcharge for incomes above $1 million is the highest in the country. Arizona’s flat 2.5% rate applies across income levels with no graduated tiers. For a San Diego household earning $200,000, the rate spread can translate to $15,000 to $20,000 in estimated annual savings. Over a decade, that $150,000 to $200,000 cumulative delta becomes a second equity event, stacking year after year on top of the home-sale gain.
San Diego’s equity opportunity is sharpened by one of the tightest affordability pictures in the nation. According to the California Association of Realtors, only 13% of San Diego County households could afford the $1,000,000 median-priced home in Q3 2025 — a level that has remained near historic lows across multiple quarters. To qualify at the median, a household needed roughly $250,000 in annual income, assuming 20% down and a 6.5% mortgage rate.
That affordability figure reframes the sell-or-stay decision in concrete terms. Holding a San Diego property requires sustaining one of the country’s most demanding income thresholds just to carry the mortgage — before any additional wealth-building occurs. The asset may appreciate, but carrying costs and the tax drag on the income required to support it erode that appreciation year after year. Liquidating a maximally appreciated, maximally taxed asset and redeploying equity into a lower-cost, lower-tax market isn’t speculation. It’s arithmetic.

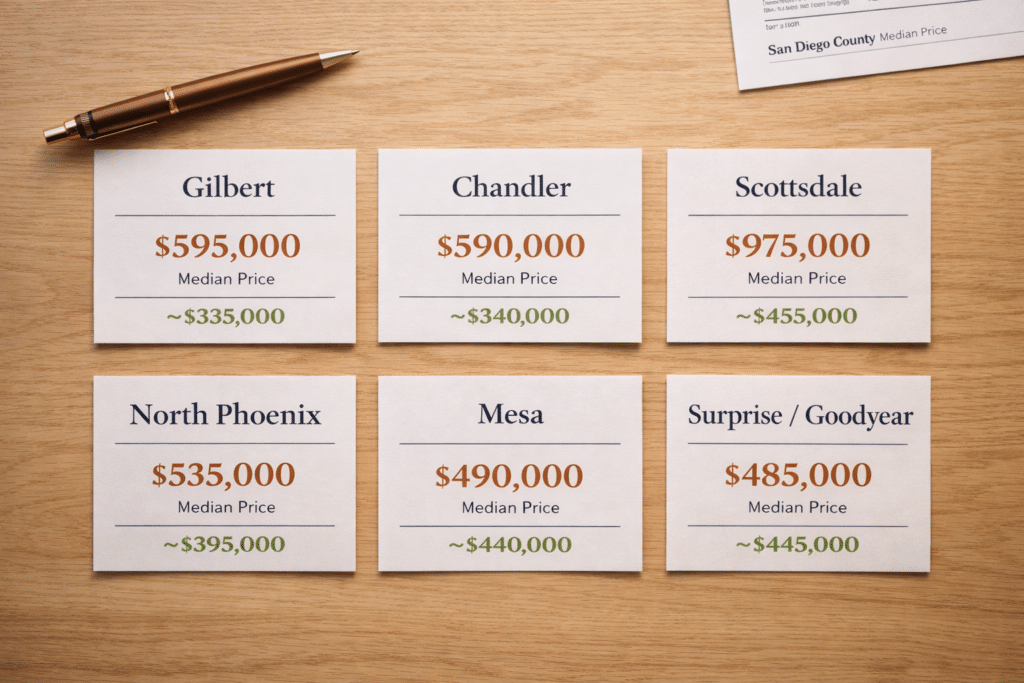
A San Diego seller at the December 2025 median carries estimated net proceeds of ~$928,000 to $942,000 after standard transaction costs. Below is how those proceeds map against current Phoenix Valley pricing.
Median: ~$595,000 (2025 YTD)
Estimated Equity Retained: ~$335,000–$345,000
Master-planned communities with HOA-maintained parks, pools, and ramadas; one of the Valley’s most active new-construction submarkets.
Median: ~$540,000
Estimated Equity Retained: ~$390,000–$400,000
Established neighborhoods, strong resale inventory, tech-corridor proximity along the Price Road Corridor, broad range from entry-level to luxury.
Median: ~$1,180,000 (2025 YTD)
Estimated Equity Retained: ~$0 to negative at the Scottsdale median; net-even or slight surplus at higher San Diego price points
The Valley’s premium submarket. At the SD median, Scottsdale typically requires additional capital.
Range: ~$550,000--$700,000
Estimated Equity Retained: ~$230,000–$380,000
Newer builds along Loop 101 and Loop 51; large master-planned footprint with HOA-managed amenities across most communities.
Median: ~$490,000 (2025)
Estimated Equity Retained: ~$440,000–$450,000
Broad inventory across a large footprint; consistent value per square foot relative to East Valley medians.
Median: ~$430,000
Estimated Equity Retained: ~$498,000–$510,00
Maximum square footage per dollar; fastest-growing submarket by new-construction permits; direct I-10 access east toward Phoenix.
Price data: ARMLS, Phoenix REALTORS year-to-date 2025 reports. Equity retained estimates assume 6% transaction costs on the San Diego sale plus standard Phoenix closing costs. Results vary based on sale price, loan payoff, and negotiated terms.
San Diego sellers above the county median common in coastal submarkets where prices routinely exceed $1.5M–$2.5M can access any Valley destination and retain equity figures that overwhelm Scottsdale’s premium. A $1.8M San Diego sale nets roughly $1,690,000–$1,710,000 in proceeds. Purchasing in Scottsdale at $1,180,000 retains approximately $510,000–$530,000 in net equity in the Valley’s top-priced market.
California’s income tax structure applies with full force to San Diego County households regardless of location or proximity to lower-tax neighboring states. A dual-income household in Chula Vista earning $250,000 faces the same top marginal structure as a household in San Francisco earning the same amount. The 13.3% maximum rate, alongside California’s property and sales tax structure, produces an annual tax burden that the Valley’s 2.5% flat income tax does not replicate.
A San Diego-specific nuance: many long-term owners carry Proposition 13–capped assessed values far below current market value. A homeowner who purchased in 2005 at $550,000 may carry an assessed value of $650,000–$700,000 today on a home now worth $1,000,000, producing a property tax bill around $5,000–$5,500 annually. Once that home sells, the Prop 13 protection ends. The next California purchase is assessed at full purchase price. In Maricopa County, a full assessment at $600,000 runs about $3,100 per year — often below what long-term San Diego owners already pay even under Prop 13.

| Tax Category | California (SD County) | Arizona (Maricopa Co.) |
|---|---|---|
| Top State Income Tax Rate | 13.3% (+ 1.1% surcharge) | 2.5% flat |
| Effective Property Tax Rate | ~0.73% | ~0.52% |
| Avg Combined Sales Tax | 8.25% (SD County avg) | 8.40% |
| Property Tax on $500K Assessed Value | ~$3,650–$4,000/yr | ~$2,600/yr |
| State Income Tax on $200K AGI | ~$14,300–$17,500/yr | ~$5,000/yr |
| Estate / Inheritance Tax | None | None |
Sources: Tax Foundation, 2025 State Income Tax Rates; Maricopa County Treasurer; California Franchise Tax Board
San Diego’s overall cost of living runs roughly 40%–50% above the national average (per BLS Consumer Expenditure data) less extreme than the Bay Area, but still far above the Phoenix metro’s ~3%–6% above-average index. The gap is most pronounced in housing and auto-related costs, including insurance. San Diego’s coastal positioning drives elevated homeowners insurance premiums, influenced by wildfire and flood exposure zones across portions of the county.
The most measurable delta is the monthly mortgage payment. A household carrying a ~$4,800/month payment on a $950,000 San Diego home at 6.5% with 20% down could carry a comparable or larger home in Gilbert or Chandler at roughly $2,600–$3,100/month freeing up $1,700–$2,200 in monthly cash flow. Over 10 years, that shift represents $204,000–$264,000 that can be redirected into investing, accelerated paydown, or retirement contributions.
One category where Phoenix is not cheaper: summer cooling. Electric bills of $250–$400/month are common from June through September. Factor that seasonal premium into annual comparisons — while also noting that it is often offset by lower insurance costs, lower property tax liability, and the absence of California’s tiered electricity rate structure.
San Diego County is the second-largest California county source of Arizona-bound migration in IRS data, trailing only Los Angeles County. For the 2021-2022 filing year, IRS SOI data shows 8,433 San Diego County tax filers moved to Arizona, producing a net flow of +4,099 in Arizona’s favor. That net figure implies roughly a 2:1 imbalance: about two residents leaving for Arizona for every one moving back.
Geography adds another advantage: relocation logistics are manageable. The I-8 corridor connects San Diego to the Phoenix metro in roughly five to six hours by vehicle. That doesn’t change the tax or equity equation, but it reduces transition friction and the migration data reflects that, with the San Diego-to-Maricopa corridor consistently ranking among the most active county-level flows in the West.
Income profile matters here. IRS income-bracket analysis shows migration in the $100,000–$200,000 bracket (and above) is accelerating faster than lower brackets across California-to-Arizona corridors. San Diego’s high home prices and above-average incomes mean the outmigrant pool skews toward homeowners with substantial equity, not distressed households. California as a whole posted a net loss of 143,594 income tax filers in the 2021–2022 filing year and lost $23.8B in AGI, per Center for Jobs analysis of IRS data. Arizona was the #2 destination for California outmigrants, behind Texas.

San Diego County spans multiple residential submarkets with meaningfully different pricing. The equity equation varies by submarket. Snapshot ranges below are based on available ARMLS and Greater San Diego Association of REALTORS reporting through 2025.
Estimated Range: $1,400,000–$2,500,000+
Coastal pricing typically runs 40%–150% above the county median. At $1,500,000, estimated net proceeds are ~$1,408,000–$1,425,000. Against most Valley destinations, retained equity lands well into seven figures.
Estimated Range: $1,600,000–$3,500,000+
One of the county’s highest-priced areas. Sellers in this range can access Scottsdale’s premium inventory while still retaining six to seven figures in net equity after closing.
Estimated Range: $650,000–$850,000
Pricing below the county median. Net proceeds at $750,000 are roughly $702,000–$712,000. Six figures retained versus most Valley destinations; closer to parity with Scottsdale.
Estimated Range: $700,000–$950,000
Wide range with notable new-construction activity in eastern Chula Vista corridors. Upper-range sellers retain six figures against all Valley destinations except Scottsdale.
Submarket ranges are estimates based on Greater San Diego Association of REALTORS data and publicly available MLS reporting through Q4 2025. Individual properties vary. Verify current pricing with a licensed real estate professional.