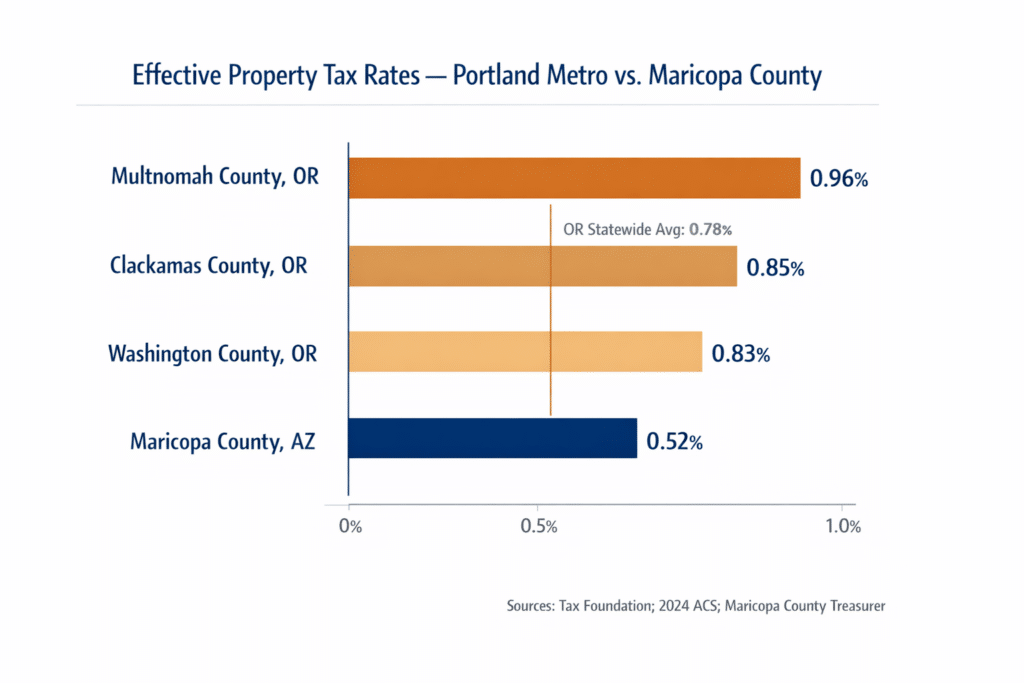
Multnomah County’s effective property tax rate is 0.96%. Washington County’s is 0.83%. Clackamas County’s is approximately 0.85%. Maricopa County’s median effective rate is 0.52%. This page explains how both systems work, quantifies the annual and 10-year dollar difference at six price points, and addresses the mechanism that determines what a new Portland buyer actually pays on their first tax bill — and why that number may be different from what the prior owner paid.
Statewide effective rate comparisons provide a directional frame. For Portland metro homeowners, the relevant comparison is between the tri-county Portland metro rates — which are materially higher than Oregon’s statewide average — and Maricopa County. Multnomah County’s effective rate of 0.96% is 44 basis points above Oregon’s 0.78% statewide average, reflecting the density of local option levies, urban renewal district taxes, and bond measures that accumulate in Portland’s urban core.
The gap between Multnomah County and Maricopa County is 0.44 percentage points — not the statewide 0.26 percentage points. At a $600,000 home, those 44 basis points represent $2,640 per year — every year of ownership. At $800,000, they represent $3,520 per year.
A financial guide that uses only Oregon’s statewide 0.78% figure understates the property tax savings available to Portland sellers specifically. This page uses both: the statewide rate for context, and the Portland tri-county rates for precision.
Oregon effective property tax rate — owner-occupied housing
SOURCE: Tax Foundation (most recent reported data, based on U.S. Census American Community Survey)
Maricopa County, Arizona median effective rate — owner-occupied housing
SOURCE: Maricopa County Treasurer; Ownwell Maricopa County property tax analysis, 2024
Statewide rate difference (0.78% OR minus 0.52% AZ) DOLLAR EQUIVALENT: At $600,000, this gap is $1,560/year in Arizona’s favor
SOURCE: Calculated from Tax Foundation and Maricopa County Treasurer rates above
Source: Tax Foundation; Maricopa County Treasurer
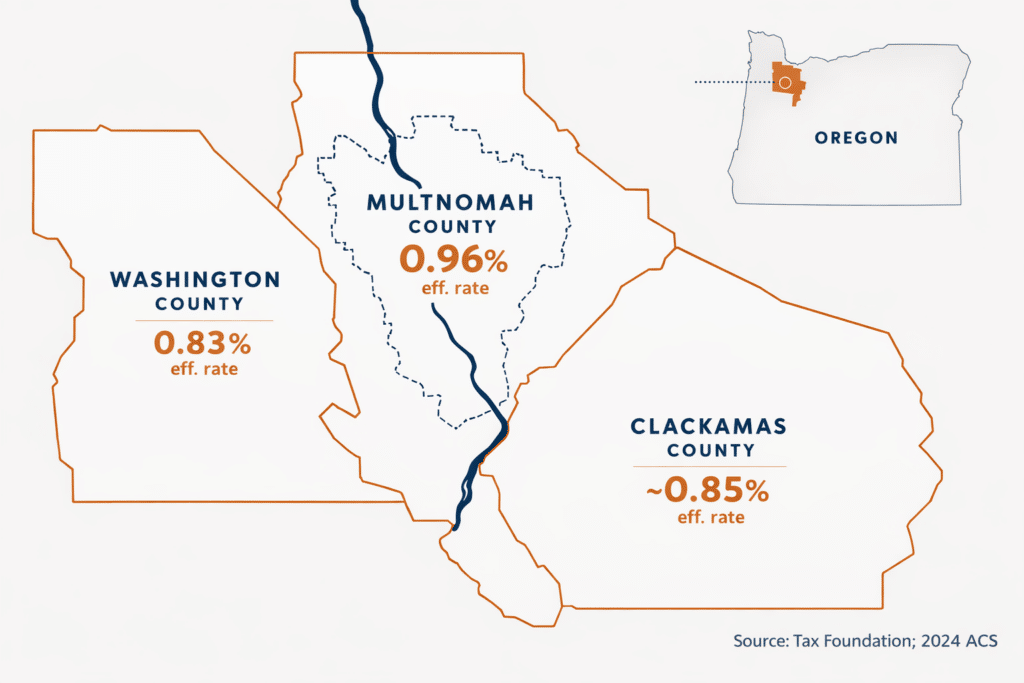
The Portland metropolitan area spans three primary counties — Multnomah, Washington, and Clackamas — each with its own effective property tax rate for owner-occupied housing. The rates vary because each county carries a different combination of permanent levy rates, local option levies, bond measures, and urban renewal special levies. The rates below represent county-level effective rates applied to real market value, based on the 2024 American Community Survey.
| Portland Net Proceeds (Estimated) | Down Payment (20%) | Chandler Purchase Price (Approx.) | Chandler Market Tier |
|---|---|---|---|
| ~$113,000–$140,000 | 20% | $565,000–$700,000 | At / above median |
| ~$140,000–$180,000 | 20% | $700,000–$900,000 | Mid-tier |
| ~$180,000–$240,000 | 20% | $900,000–$1,200,000 | Upper-mid |
| ~$240,000–$320,000 | 20% | $1,200,000–$1,600,000 | Premium tier |
| ~$320,000–$400,000 | 20% | $1,600,000–$2,000,000 | Luxury tier |
| Cash / large equity position | varies | $400,000–$565,000 | Below median, high mortgage reduction |
2024 American Community Survey (U.S. Census Bureau), as reported by Tax Foundation. Portland metro median (~$537,000, Q1 2025): RMLS Monthly Market Action Report. Rate × home value = estimated annual tax for illustrative purposes; actual bills depend on specific property’s assessed value, applicable levies, exemptions, and special district charges.
One additional note on Multnomah County specifically: Portland has been periodically cited among the highest effective property tax cities in the nation for owner-occupied homes of comparable market value. A Lincoln Institute of Land Policy analysis cited Portland at fifth nationally for effective property tax burden on a median-valued home — a ranking reflecting the combination of Multnomah County levies and Portland city levies that stack on top of state-level rates. For Portland homeowners whose primary financial reference point for property taxes is their Multnomah County bill, the gap to Maricopa County is the widest of any origin market in the Portland silo.
Oregon’s property tax structure is governed by two voter-approved ballot measures that fundamentally changed how property is assessed and how rates are capped. Understanding these mechanisms matters for Portland homeowners who are evaluating what their property tax bill has been versus what a new buyer in Portland would pay — and how both compare to Arizona’s structure.
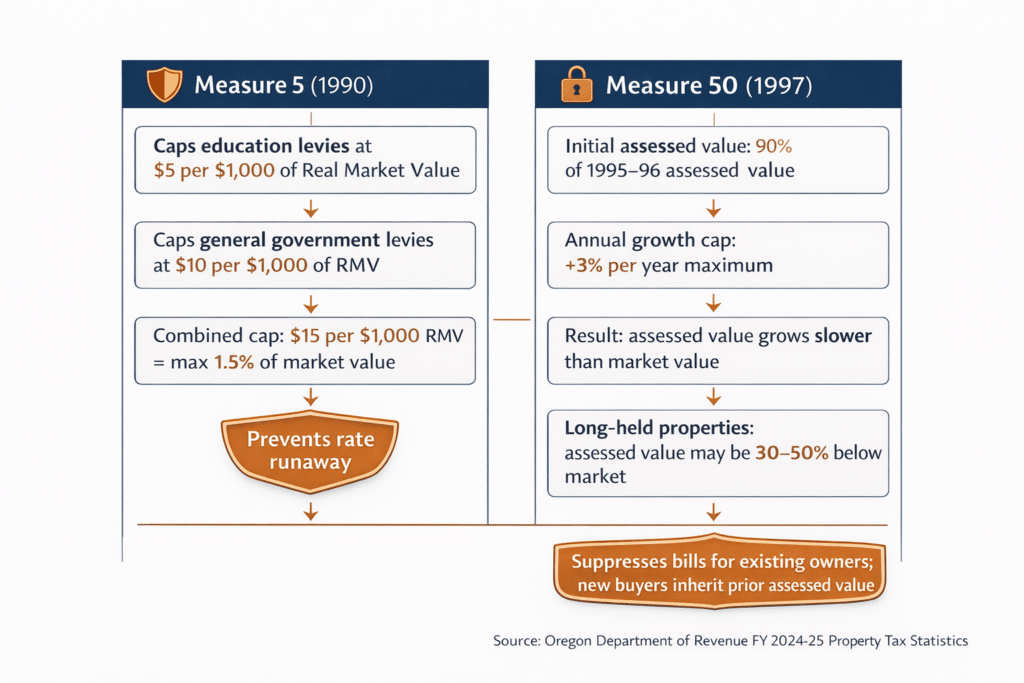
Measure 5 limits total property tax rates applied to real market value (RMV):
Education levies: Cannot exceed $5 per $1,000 of RMV ($5.00/$1,000) General government levies: Cannot exceed $10 per $1,000 of RMV ($10.00/$1,000) Combined cap: $15 per $1,000 of RMV = 1.5% of market value
This cap prevents any property from paying more than 1.5% of its real market value in property taxes, regardless of how many local levies, bond measures, and special districts layer onto the bill. The cap is applied to individual properties — not districts — meaning that if the combined rate would exceed the limit, the district absorbs the “compression” and collects less than the full levy.
For Portland homeowners, Measure 5 has largely kept total effective rates below the 1.5% ceiling, even in Multnomah County’s high-levy environment. The 0.96% Multnomah effective rate sits within this cap.
Measure 50 separates assessed value from market value and limits the annual growth of assessed value to 3% for existing property owners. In 1997, the measure reduced all assessed values to 90% of their 1995-96 assessed value. Since then, assessed values have grown at a maximum of 3% per year.
The practical consequence: in a market where real values have appreciated faster than 3% annually — which describes the Portland metro over most of the period from 1997 to 2025 — assessed values for long-held properties are substantially below current market value. A Portland homeowner who has owned since 1997 may have an assessed value 30–50% below current market value.
When a property sells in Oregon, the assessed value is not automatically reset to market value. Instead, the assessed value for the new owner is:
The LESSER of:
(a) The real market value (the purchase price as market benchmark); or
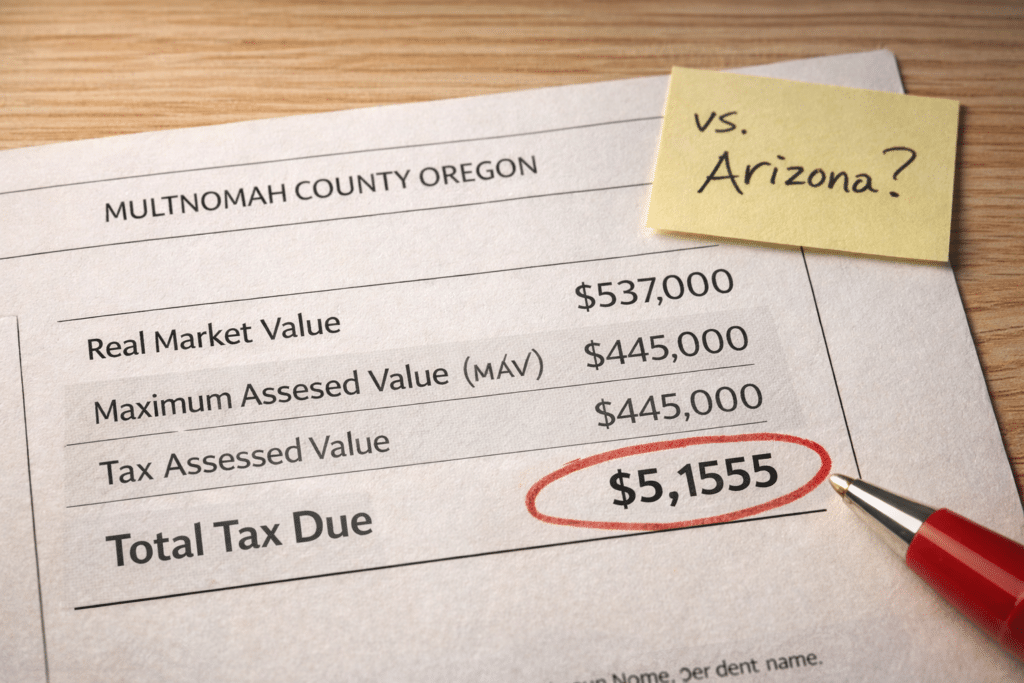
(b) The Maximum Assessed Value (MAV) — which is 103% of the prior year’s assessed value
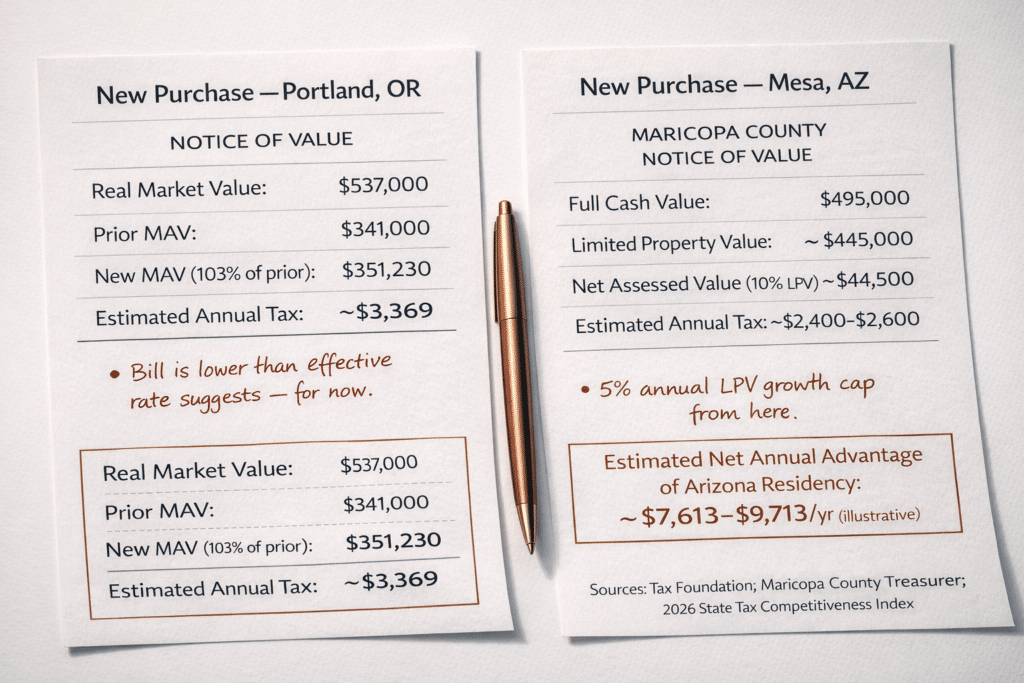
For a new Portland buyer in 2024 purchasing a home whose prior owner had held it since 2005 with a low assessed value, the assessed value resets to 103% of the prior MAV — not to the $537,000 purchase price. This means the new buyer’s property tax bill will be lower than what a straightforward rate-times-market- value calculation would suggest. However, the assessed value will grow at 3% annually and will converge toward market value over time if market appreciation slows. New construction and major improvements reset assessed value at a higher base.
Portland homeowners evaluating their property tax “as paid” should be aware that their current assessed value — and therefore their current tax bill — may be significantly lower than what the next buyer of their home will pay once assessed value adjusts over time. The rates cited on this page (effective rates expressed as taxes paid / market value) reflect actual taxes paid by all current owner-occupants, including long-term owners with suppressed assessed values. For a new buyer in Oregon, the actual first-year tax bill could be lower than the effective-rate estimate or could be close to it, depending on the prior owner’s assessed value basis.
This Oregon assessed-value complexity does not eliminate the rate differential with Arizona — it complicates how to express it precisely for new buyers. Consult the specific property’s assessed value in the county records before estimating property tax for a potential Oregon purchase.
Arizona’s property tax system applies a different structure — one that is simpler to interpret for buyers evaluating year-one costs, and one that produces consistently lower effective rates for residential property.
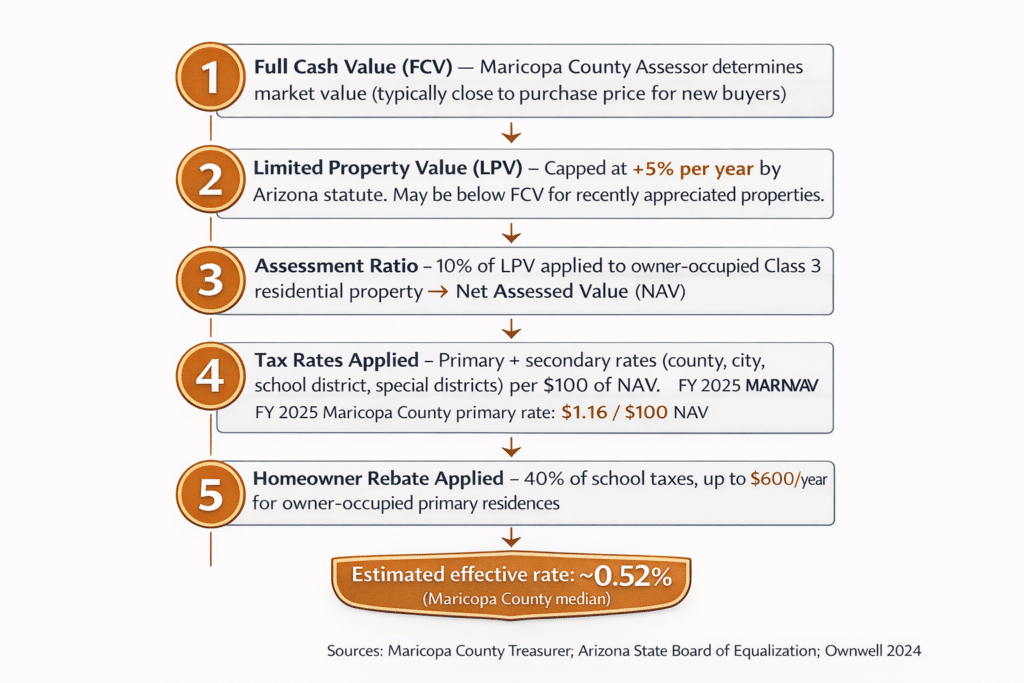
Full Cash Value (FCV): The Maricopa County Assessor determines the property’s market value (Full Cash Value). For a newly purchased home, this is typically close to the purchase price.
Assessment Ratio (10%): The LPV is multiplied by the assessment ratio for Class 3 residential property (owner-occupied): 10%. This produces the Net Assessed Value (NAV).
Homeowner Rebate: Owner-occupants receive a credit equal to 40% of school property taxes, up to $600 per year. This rebate is applied automatically on primary residences.
Limited Property Value (LPV): The LPV is a separate, constrained value used for calculating primary property taxes. Under Arizona statute, the LPV can increase by no more than 5% per year. For a newly purchased home where the prior LPV was below current market value, the new LPV is calculated using a statutory formula — but it cannot exceed the FCV. In practice, the LPV for most recently purchased homes is meaningfully below the purchase price in a market that has appreciated, which is one mechanism that keeps Arizona’s effective rates below the nominal rate that would result from rate × market value.
Tax Rates Applied: Primary and secondary tax rates (set by the county, city, school district, and special districts) are applied per $100 of NAV to produce the tax bill. The primary rate for Maricopa County’s general fund for fiscal year 2025 is $1.16 per $100 of assessed value. Citywide rates, school district rates, and special district rates stack on top of the county rate.
For a home purchased at $565,000 (the Chandler 2024 median) in Maricopa County:
Approximate LPV (new purchase, estimated): ~$480,000–$540,000 LPV × 10% assessment ratio: ~$48,000–$54,000 (NAV) NAV × estimated combined primary + secondary tax rate (~$10–$12 per $100): ~$4,800–$6,480 before homeowner rebate After estimated homeowner rebate (up to $600): ~$4,200–$5,880
Effective rate as paid / market value: approximately 0.40%–0.52%
This range is consistent with Maricopa County’s reported median effective rate of 0.52% (Maricopa County Treasurer; Ownwell, 2024). Rates vary by city, school district, and special district — and can be higher or lower than the county median.
IMPORTANT: This is an illustrative approximation. Actual Maricopa County property tax bills depend on the specific property’s assessed value (as determined by the Maricopa County Assessor), the applicable school district rate, city tax rate, and any special district charges. Use the Maricopa County Assessor’s online property search to look up the specific assessed value and estimated tax for a property you are evaluating.
The table below uses the effective rates established in Sections 3 and 4 to produce annual and monthly property tax estimates at six price points relevant to Portland homeowners evaluating their Arizona options. Three Oregon rates are shown — Multnomah, Washington, and Oregon statewide — to represent the most common Portland-area tax positions. The Arizona figure uses Maricopa County’s median effective rate of 0.52%.
All figures are estimates. Actual bills depend on assessed value, exemptions, local option levies, bond measures, and school district rates. The purpose of this table is to establish the magnitude of the differential — not to quote a specific property’s tax bill.
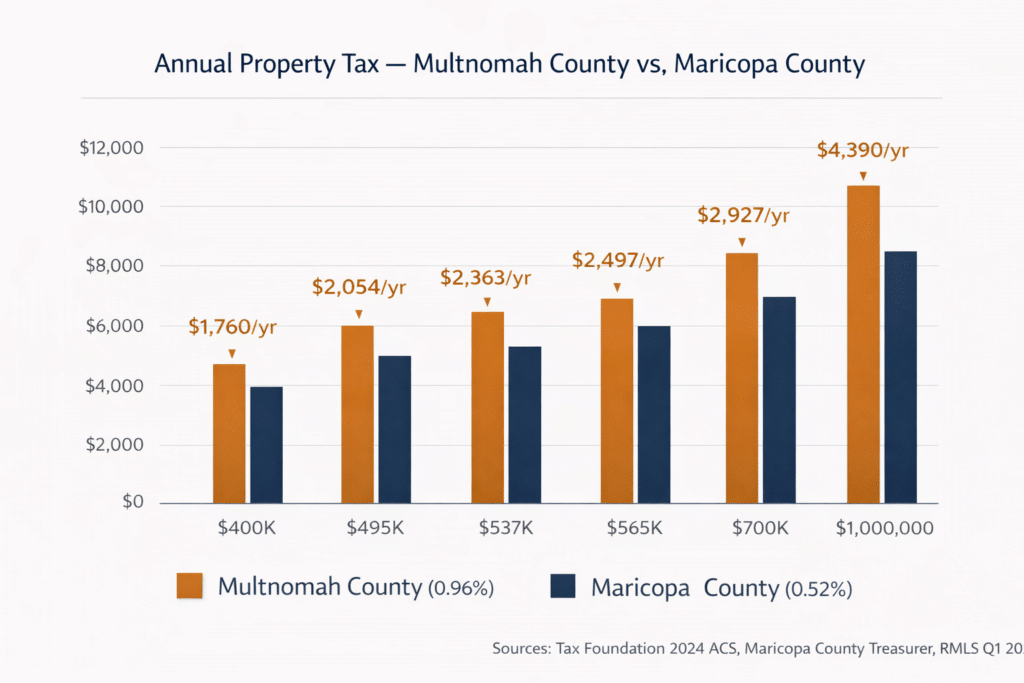
| Home Value | Multnomah County Annual Tax (0.96%) | Washington County Annual Tax (0.83%) | OR Statewide Annual Tax (0.78%) | Maricopa County Annual Tax (~0.52%) | Annual Savings vs. Multnomah County |
|---|---|---|---|---|---|
| $400,000 | ~$3,840/yr (~$320/mo) |
~$3,320/yr (~$277/mo) |
~$3,120/yr (~$260/mo) |
~$2,080/yr (~$173/mo) |
~$1,760/yr |
| $495,000 (Mesa median) | ~$4,752/yr (~$396/mo) |
~$4,109/yr (~$342/mo) |
~$3,861/yr (~$322/mo) |
~$2,574/yr (~$215/mo) |
~$2,178/yr |
| $537,000 (Portland median) | ~$5,155/yr (~$430/mo) |
~$4,457/yr (~$371/mo) |
~$4,189/yr (~$349/mo) |
~$2,792/yr (~$233/mo) |
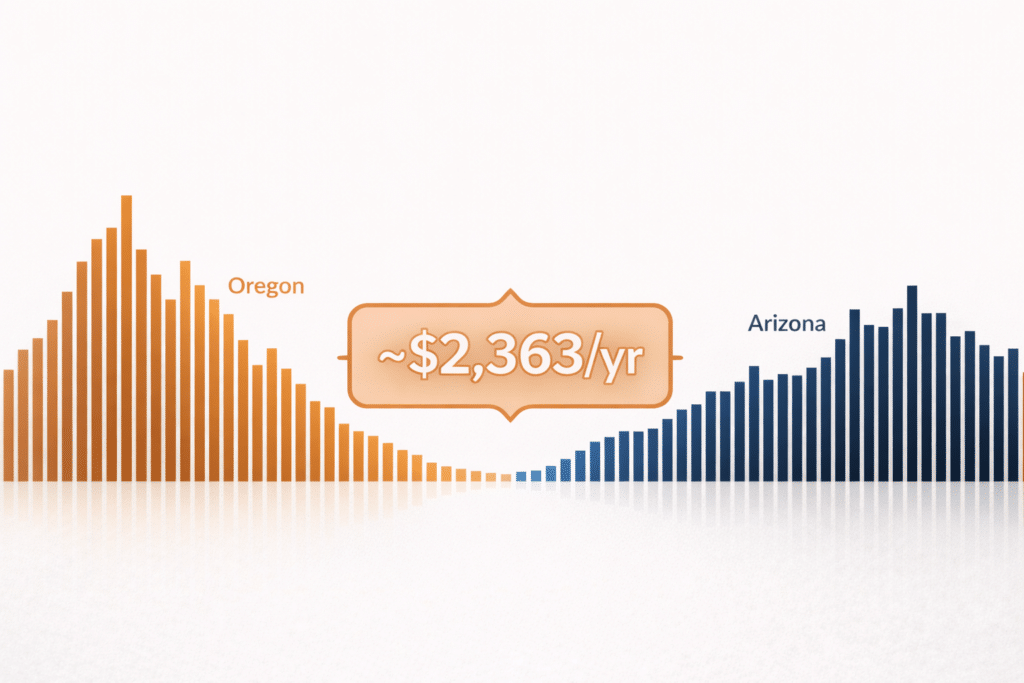
~$2,363/yr |
| $565,000 (Chandler median) | ~$5,424/yr (~$452/mo) |
~$4,690/yr (~$391/mo) |
~$4,407/yr (~$367/mo) |
~$2,938/yr (~$245/mo) |
~$2,486/yr |
| $700,000 | ~$6,720/yr (~$560/mo) |
~$5,810/yr (~$484/mo) |
~$5,460/yr (~$455/mo) |
~$3,640/yr (~$303/mo) |
~$3,080/yr |
| $1,000,000 | ~$9,600/yr (~$800/mo) |
~$8,300/yr (~$692/mo) |
~$7,800/yr (~$650/mo) |
~$5,200/yr (~$433/mo) |
~$4,400/yr |
| $1,200,000 (Scottsdale entry-mid) | ~$11,520/yr (~$960/mo) |
~$9,960/yr (~$830/mo) |
~$9,360/yr (~$780/mo) |
~$6,240/yr (~$520/mo) |
~$5,280/yr |
source: Tax Foundation (effective rates on owner-occupied housing, 2024 ACS); Multnomah County 0.96%, Washington County 0.83%, Oregon statewide 0.78%. Arizona rate source: Maricopa County Treasurer; Ownwell Maricopa County property tax analysis, 2024. All figures are estimates; actual tax bills depend on assessed value, applicable levies, exemptions, and special district charges specific to each property.
Two observations worth noting:
First, the savings compound at the top of the range. A Portland seller who uses their equity to purchase a $1,200,000 Scottsdale home saves approximately $5,280/year compared to the Multnomah County rate on an equivalent value — even though the Arizona purchase price is higher than anything the Portland home was valued at. The percentage rate advantage of Arizona applies to every dollar of home value.
Second, the monthly framing matters for PITI budgeting. At $700,000, the Multnomah County monthly property tax is approximately $560/month; Maricopa County’s is approximately $303/month — a $257/month reduction embedded in every mortgage payment’s escrow component, every month. For a purchaser running monthly cash flow analysis, this is a recurring advantage that does not show up in the interest rate comparison.
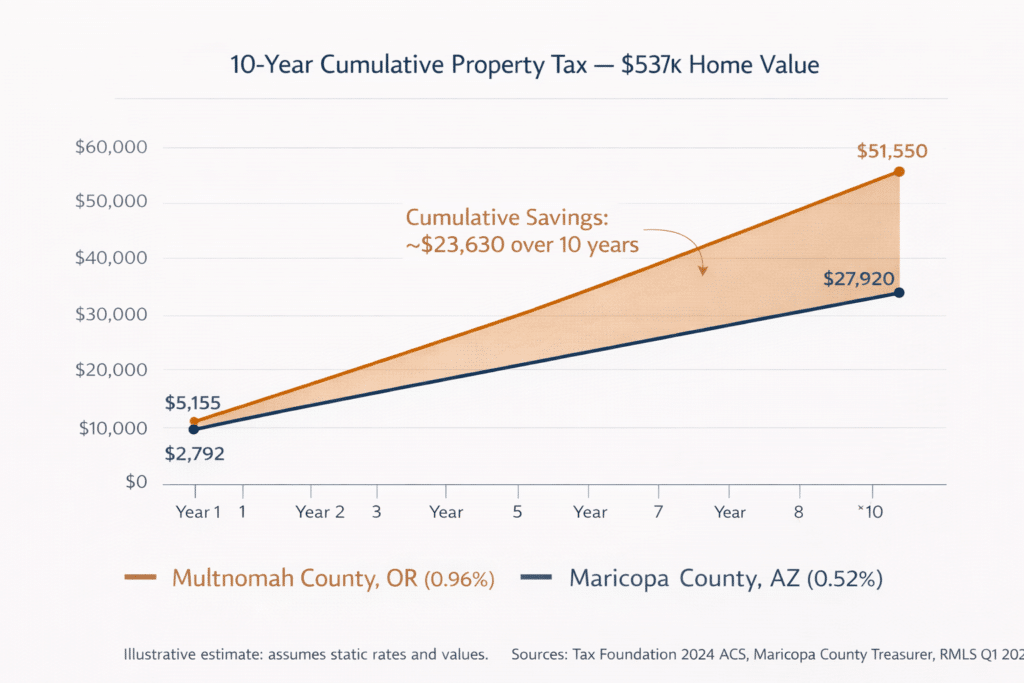
The annual differential understates the financial significance of the rate gap over time. The table below presents 10-year cumulative property tax estimates at each price point — Oregon (Multnomah County rate) vs. Maricopa County — under a simplified assumption that the effective rate stays constant and home values do not change. This understates the real 10-year value of the difference (because both assessed and market values will change), but it provides a conservative, defensible baseline for comparison.
Estimated 10-year cumulative property tax savings (Multnomah County vs. Maricopa County) at the Portland metro median of $537,000 — before income tax reduction, equity appreciation, or HOA/cost-of-living differentials
SOURCE: Tax Foundation Oregon rate (0.96% Multnomah); Maricopa County Treasurer (0.52%); RMLS Q1 2025 Portland metro median (~$537,000)
| Home Value | 10-Year Multnomah County Property Tax (0.96%) | 10-Year Maricopa County Property Tax (0.52%) | 10-Year Cumulative Savings (Multnomah vs. Maricopa) |
|---|---|---|---|
| $495,000 | ~$47,520 | ~$25,740 | ~$21,780 |
| $537,000 | ~$51,552 | ~$27,924 | ~$23,628 |
| $565,000 | ~$54,240 | ~$29,380 | ~$24,860 |
| $700,000 | ~$67,200 | ~$36,400 | ~$30,800 |
| $1,000,000 | ~$96,000 | ~$52,000 | ~$44,000 |
| $1,200,000 | ~$115,200 | ~$62,400 | ~$52,800 |
NOTE: These 10-year estimates assume static home values and static effective rates — neither of which will occur in practice. Actual cumulative savings will differ based on assessed value changes (capped at 3% annually in OR; 5% annually in AZ), market appreciation, levy changes, exemption adjustments, and applicable bond measure expirations. This table is presented as an order- of-magnitude illustration, not a projection of future tax liability.
Property tax is one of three financially significant tax lines that change when a Portland homeowner relocates to Maricopa County. Understanding how it relates to the other two helps Portland homeowners calibrate the total annual financial impact of the relocation decision.
LINE 1 — PROPERTY TAX: At $537,000 home value, the Multnomah-to-Maricopa annual savings is approximately $2,363 (as shown in Section 7). This is a relatively predictable, recurring savings that does not depend on earned income, investment income, or filing strategy. It is embedded in the escrow component of every mortgage payment and reduces PITI dollar-for-dollar from the first month of Arizona ownership. The 10-year cumulative value at this price point is approximately $23,628 (Section 8) at static rates.
LINE 2 — INCOME TAX: Oregon’s combined Portland-area income tax stack reaches a top rate of up to 13.9% (Oregon state rate: 4.75%–9.9% + Multnomah County rate: 1.5%–3% + Metro Supportive Housing Services tax: 1%). Arizona’s flat rate: 2.5%. At $150,000 household income, the estimated annual income tax savings of relocating from Portland to Arizona is approximately $7,650–$8,750 (Tax Foundation, 2025 rates / 2026 State Tax Competitiveness Index).
LINE 3 — SALES TAX OFFSET: Oregon levies no state sales tax. Arizona’s state rate is 5.6%, with Maricopa County adding 0.7% (total base: 6.3%, with city surtaxes reaching up to 10.7% in some jurisdictions). For Portland homeowners evaluating the combined tax picture, the absence of an Oregon sales tax represents a cost that Arizona buyers will encounter on everyday purchases. For most households, the income tax and property tax savings substantially exceed the sales tax cost — but the offset should be included in a complete analysis.
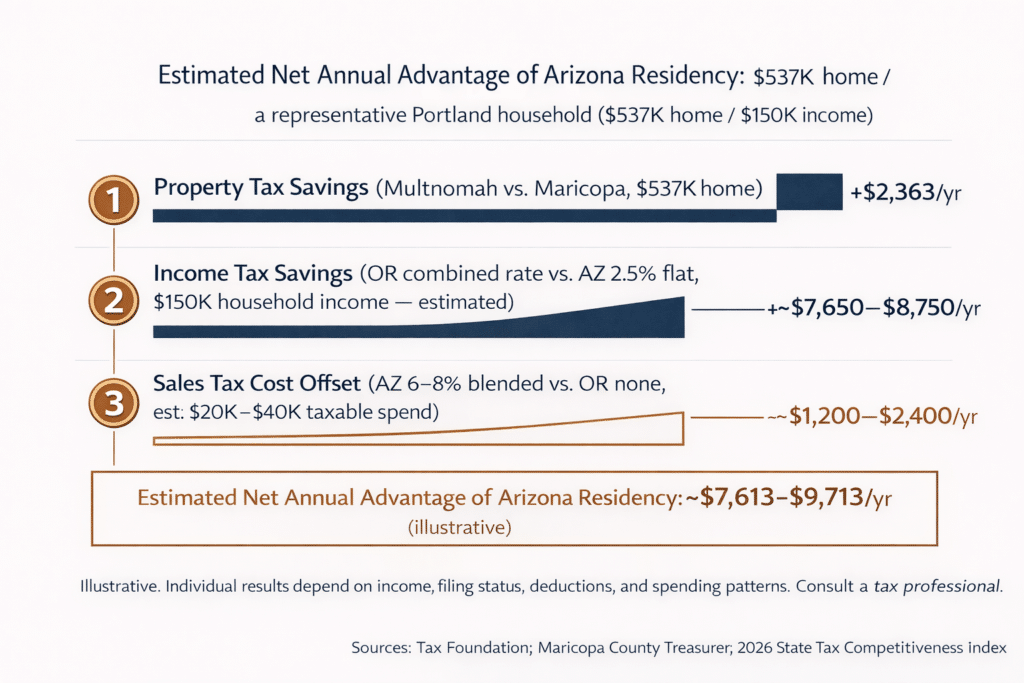
IMPORTANT: These estimates are illustrative only and rely on effective rate proxies, not individual tax modeling. Individual results depend on filing status, deductions, other income, applicable exemptions, and spending patterns. Consult a licensed CPA or tax professional for household-specific projections before making a relocation decision.
The effective rate tables tell the story for current owners. New buyers in both states face a more specific question: what will my first-year tax bill actually be, based on the property’s current assessed status?
The assessed value you inherit depends on the prior owner’s Maximum Assessed Value (MAV). If the prior owner held the property for many years and benefited from Oregon’s 3% cap, the MAV may be significantly below market value. Your first-year bill will be calculated on 103% of the prior year’s MAV — not the purchase price. This is advantageous for the new buyer in the first few years of ownership, as the assessed value grows at 3% per year from this lower starting point. However, if market values do not continue to outpace 3% growth, the assessed value will converge toward market value over time.
Practical implication: A Portland buyer purchasing a home for $537,000 whose prior owner held it since 2008 may find that the assessed value is in the $350,000–$420,000 range. The first-year tax bill would be based on that lower assessed value, producing an effective rate (taxes / purchase price) that is materially below the 0.96% effective rate cited for current owners. Over time, if market values plateau, the assessed value catches up.
For a new purchase in Maricopa County, the Full Cash Value (FCV) is typically set close to the purchase price. The Limited Property Value (LPV) for the first year after purchase is calculated using a statutory formula and may be somewhat below the FCV — particularly if the prior LPV had not converged to market value. The 10% assessment ratio is then applied to the LPV, and rates are applied to the resulting NAV.
In practice: Maricopa County new buyers typically receive a Notice of Value in late January or early February of the year following purchase, reflecting the new valuation. The first full-year tax bill is usually based on a LPV that is 80%–100% of the purchase price, subject to the 5% annual cap on LPV increases. The Homeowner Rebate (40% of school taxes, up to $600) applies from the first year if the property is the owner’s primary residence.
Practical implication: A Maricopa County buyer purchasing at $565,000 can use the Maricopa County Assessor’s online valuation tool to look up the current assessed value of the specific property. The Maricopa County Treasurer website provides a property tax estimator that produces a site-specific bill estimate before purchase.
The assessed value mechanisms in both states add complexity to any exact first-year tax estimate. For planning purposes, the effective rates in Section 7’s table provide a conservative upper-bound estimate of Arizona costs (because Maricopa County’s effective rate may be somewhat lower than 0.52% in the first year if the prior LPV was well below market value). For Oregon costs, the effective rate is a reasonable approximation for current owners but may overstate the first-year bill for new buyers inheriting a prior low assessed value.
When comparing a Portland property to a Phoenix Valley property, request the current Maricopa County assessed value and estimated tax from the seller’s agent or directly from the Maricopa County Assessor before making an offer.
The table below applies Maricopa County’s 0.52% effective rate to the 2024 median sold prices of the four Portland silo destinations, producing a first- year property tax estimate for a purchase at each market’s median. The annual savings column compares each to the Multnomah County (0.96%) rate on the same value.
| Destination | 2024 Median Sold Price (ARMLS 2024) | Maricopa County Annual Tax (0.52% est.) | Multnomah County Annual Tax on Same Value | Annual Property Tax Savings (Multnomah vs. Maricopa) |
|---|---|---|---|---|
| Mesa | $495,000 | ~$2,574/yr | ~$4,752/yr | ~$2,178/yr |
| Chandler | $565,000 | ~$2,938/yr | ~$5,424/yr | ~$2,486/yr |
| Gilbert | $601,750 | ~$3,129/yr | ~$5,777/yr | ~$2,648/yr |
| Scottsdale | $1,135,000 | ~$5,902/yr | ~$10,896/yr | ~$4,994/yr |
Source: ARMLS 2024 annual median sold prices (single-family). Maricopa County effective rate: 0.52% (Maricopa County Treasurer; Ownwell, 2024). Multnomah County effective rate: 0.96% (Tax Foundation / 2024 ACS). Both rates applied to the same destination price for direct comparison purposes. This comparison uses the destination market price — not the Portland sale price — because the relevant property tax for an Arizona owner is on their Arizona home value.
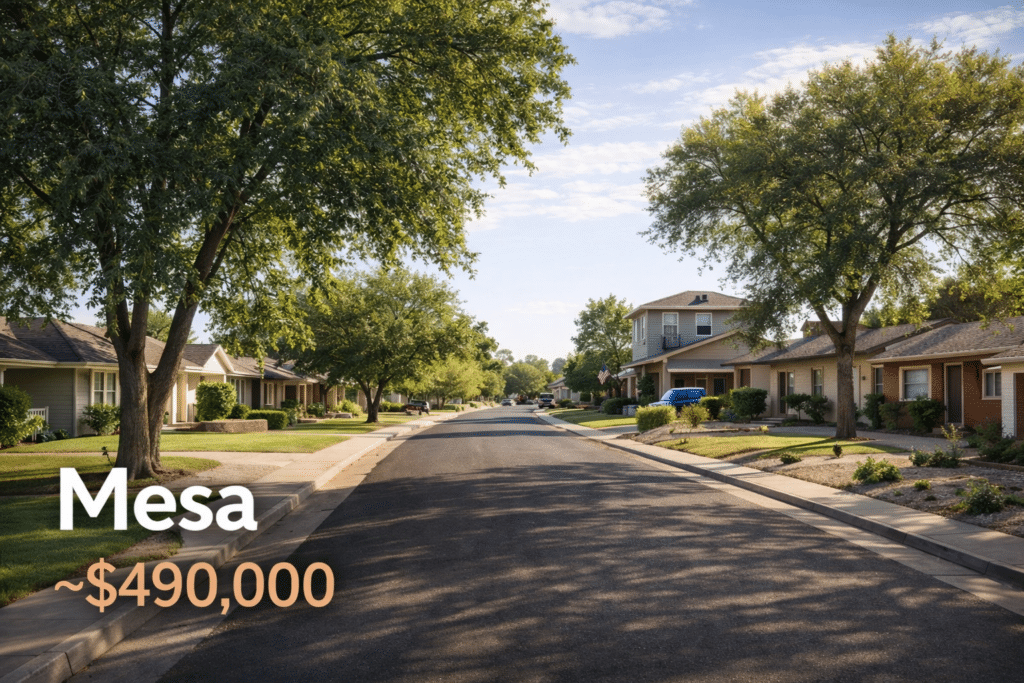
Median $495,000 | Annual property tax est.: ~$2,574/yr | 20% down: ~$99,000

Median $565,000 | Annual property tax est.: ~$2,938/yr | 20% down: ~$113,000
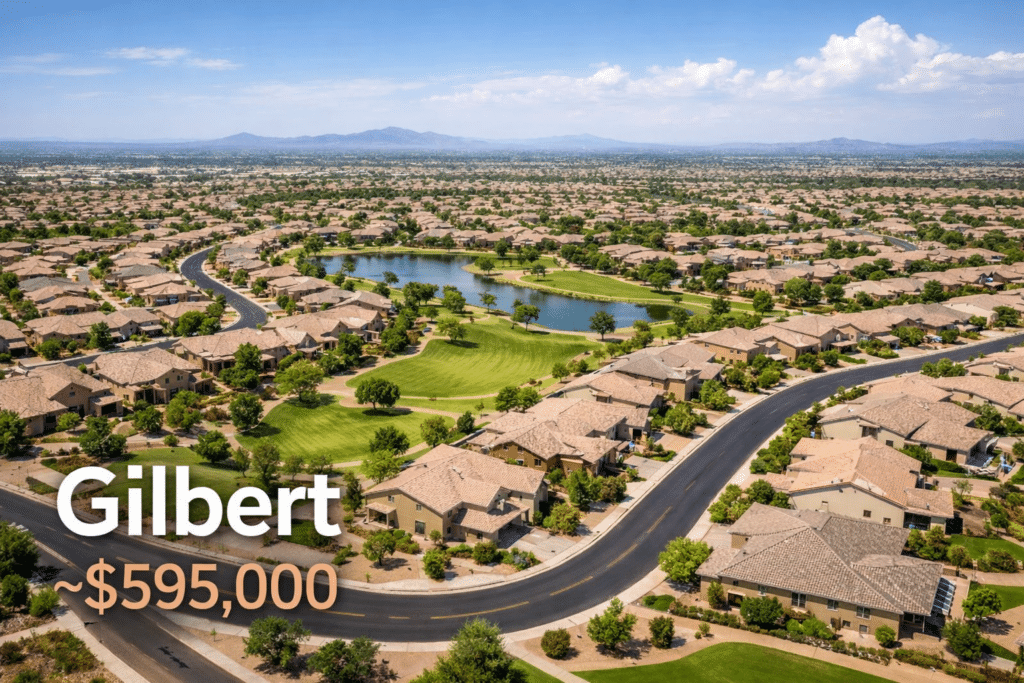
Median $601,750 | Annual property tax est.: ~$3,129/yr | 20% down: ~$120,350

Median $1,135,000 | Annual property tax est.: ~$5,902/yr | 20% down: ~$227,000
Moving from California or Seattle? The property tax savings profile is different — California uses Proposition 13 (similar to Oregon’s assessed value cap structure), and Washington has no state income tax but does levy property taxes. See the parallel comparisons:

Our brokerage partner, West USA Realty, represents buyers relocating to Gilbert, Chandler, Scottsdale, and all Phoenix Valley communities. Connect directly with a licensed Arizona agent at westusa.net.