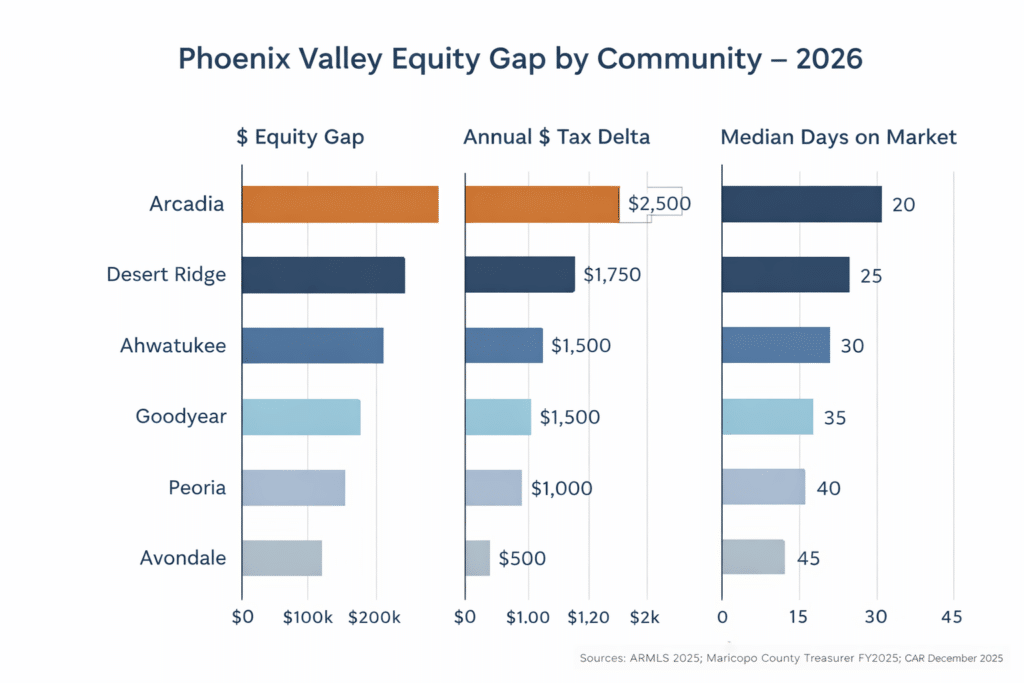
Not all Phoenix Valley communities return the same equity value. This ranking scores six major destination markets on equity gap, square footage gain, and ongoing tax delta — so you can see exactly what your California equity buys, community by community.
The question every California homeowner running the numbers should ask is not “Can I afford Arizona?” The question is: “How much of my equity survives the move — and what does it buy?”
This ranking answers that question across six Phoenix Valley destination markets. Each community is evaluated on three financial dimensions:
1. Equity Gap (the dollar differential between your California sale price and the Arizona destination median — this is money that stays in your pocket rather than going back into a new mortgage).
2. Square Footage Gain (what the same California equity position purchases in terms of finished living space in each market, using ARMLS median price- per-square-foot data).
3. Property Tax Delta (the annual ongoing savings from Arizona’s 0.52% median effective property tax rate versus the California purchase-price effective rate, applied to each community’s price point).
Origin market benchmarks used in this analysis:
Los Angeles County median (CAR, December 2025): $890,910 Inland Empire median (CAR/California ACS, 2025): $600,000 California statewide median (CAR, December 2025): $850,680
These are objective price data from approved sources. Individual net equity depends on your remaining mortgage balance, closing costs, and capital gains tax position.

(California origin median) minus (Arizona destination median) A positive gap means equity is released, not consumed. A gap above $300,000 qualifies as a strong arbitrage position.
Arizona square footage purchasable at the California equity level, divided by California square footage at the same dollar amount. A multiple above 1.5x means you’re buying at least 50% more space.
Annual property tax differential between the Arizona community price point (at 0.52% effective rate) and the equivalent California purchase (at 0.74% effective rate on new purchase).
The table below shows how each of the six major Phoenix Valley destination markets performs against two origin-market benchmarks: Los Angeles County (the highest-volume California origin) and the Inland Empire (the most common non-coastal origin market). All pricing is based on ARMLS 2025 annual data and CAR December 2025 figures. Property tax figures use Maricopa County Treasurer FY2025 effective rates.
| Community | AZ Median Price (ARMLS 2025) |
Equity Gap vs. LA Co. ($890,910 origin) |
Equity Gap vs. IE ($600,000 origin) |
Annual Tax Delta vs. CA (on AZ price at 0.52% vs. 0.74%) |
Equity Tier |
|---|---|---|---|---|---|
|
West Valley (Buckeye / Goodyear / Surprise) |
$405,000 (avg) |
+$485,910 | +$195,000 | ~$1,200/yr | Tier 1 Maximum Release |
| Mesa | $490,000 | +$400,910 | +$110,000 | ~$1,670/yr | Tier 2 Strong Release |
| Chandler | $545,000 | +$345,910 | +$55,000 | ~$2,030/yr | Tier 2 Strong Release |
| Gilbert | $572,000 | +$318,910 | +$28,000 | ~$2,220/yr | Tier 3 Balanced |
| North Phoenix / Peoria | $580,000 | +$310,910 | +$20,000 | ~$2,260/yr | Tier 3 Balanced |
|
Scottsdale (median) |
$1,000,000 (median) |
-$109,090 (equity required) |
-$400,000 (equity required) |
~$2,200/yr | Tier 4 Premium |
Sources: ARMLS 2025 annual data; CAR December 2025 Sales & Price Report; Maricopa County Treasurer FY2025 Tax Rate (0.52% effective median rate). Annual tax delta calculated as (CA effective rate 0.74% × AZ median price) minus (AZ effective rate 0.52% × AZ median price), representing the first- year savings on the Arizona home. Actual individual tax bills vary by parcel, special districts, and assessment timing. Consult a licensed Arizona tax professional for property-specific estimates. Scottsdale equity gap shown as negative where AZ median exceeds LA County origin median. West Valley average reflects Buckeye, Goodyear, and Surprise combined median as reported in ARMLS 2025 data. All figures are updated Q1 2026.
Note on Scottsdale: Scottsdale’s negative equity gap for Los Angeles County and Inland Empire homeowners does not mean Scottsdale is off the table. Bay Area homeowners — where median prices range from $1,200,000 to $1,800,000+ depending on county (CAR, 2025) — may find Scottsdale delivers a meaningful positive equity gap.
The West Valley delivers the widest equity gap in the Phoenix metro. At a combined median sale price of approximately $405,000 across Buckeye, Goodyear, and Surprise, a homeowner selling at the Los Angeles County median of $890,910 (CAR, December 2025) is looking at a raw price differential of nearly $486,000.
That differential represents capital that does not need to go into a new mortgage. At current 30-year fixed rates, $486,000 in avoided debt eliminates roughly $3,000–$3,200 per month in principal and interest — before any consideration of property tax savings or cost-of-living delta.
The trade-off in the West Valley is distance from the urban employment core. Buckeye and Surprise sit 25–40 miles from the downtown Phoenix central business district, with commute times that reflect that geography. Goodyear, positioned along the I-10 corridor, offers somewhat tighter proximity to Loop 303 employment nodes.
Inventory in the West Valley has expanded meaningfully. ARMLS data from 2025 shows inventory supply running 4.5–5.0 months in Goodyear and Surprise — a buyer-favorable environment that gives relocating homeowners negotiating leverage that simply does not exist in tighter California markets.
Median days on market in Goodyear ran approximately 80 days in 2025, the longest of any major Valley community tracked in ARMLS data — which translates into time for contingencies, inspections, and rational decision- making rather than the compressed offer timelines typical of California.
Mesa produced a 2025 median sale price of $490,000, down a fractional 0.2% year-over-year (ARMLS, 2025). Price stability — neither declining sharply nor appreciating at a pace that compresses the equity gap — is precisely the condition that makes a market attractive for equity arbitrage. A buyer does not want to overpay into appreciation; they want to capture the gap before it closes.
Mesa’s inventory supply ran 3.5 months in 2025, meaningfully tighter than the West Valley but looser than the seller-dominated conditions of Chandler or Gilbert. Closed sales in Mesa rose 0.9% year-over-year in 2025, signaling stable underlying demand without speculative excess.
Chandler’s 2025 median of $545,000 holds the second-strongest equity gap in the Tier 2 bracket. The city’s employment corridor — anchored by a significant semiconductor manufacturing presence along the Price Road corridor near Loop 101 — creates sustained demand that keeps inventory tighter than the West Valley and days on market lower than Mesa.
For Inland Empire homeowners selling at the $600,000 regional median, Chandler still delivers a positive equity gap of approximately $55,000 — a narrower margin than West Valley or Mesa, but still a net equity-accretive position, and one that comes with proximity to one of the Valley’s most active employment zones.
Gilbert’s 2025 median sale price of approximately $572,000 positions it in the Tier 3 bracket — a strong equity position for Los Angeles County homeowners, but an equity-near-neutral position for Inland Empire sellers. The key distinction: Gilbert homeowners who purchased in 2015–2019 are sitting on significant appreciated equity of their own; the challenge addressed here is the origin-market equation, not the destination-market performance.
Median days on market in Gilbert ran approximately 54 days in 2025 — faster turnover than the West Valley, reflecting sustained demand for the community’s newer housing stock. Inventory expanded year-over-year, providing buyers more selection than the compressed 2021–2022 period.
Gilbert’s housing stock skews toward master-planned communities with documented HOA amenity packages (pool, recreation facilities, trail access). For buyers whose equity position supports the price point, these structures translate into maintained common areas and enforced property maintenance standards — both of which have a documented effect on resale value retention.
North Phoenix and Peoria are producing some of the Valley’s more notable price trajectories at the sub-market level. The Stetson Valley area — proximate to the Taiwan Semiconductor Manufacturing Co. facility under active development on the I-17 corridor — posted a 12.6% median price increase to $687,000 in 2025 in that specific sub-market (ARMLS data as reported 2025).
At the broader North Phoenix / Peoria level, the 2025 median runs approximately $580,000, delivering a $310,910 equity gap for LA County homeowners. The TSMC- adjacent employment zone is a long-term demand driver for this sub-market — a factor worth weighting in any relocation equity analysis that includes a multi-year hold horizon.
For Inland Empire homeowners at the $600,000 origin median, North Phoenix is near equity-neutral on price — meaning the move does not generate a large equity windfall but does deliver a meaningful ongoing property tax reduction (~$2,260 per year in reduced tax at Arizona’s 0.52% effective rate versus the California purchase-price equivalent).
Scottsdale requires a different equity framework than any other community in this ranking. The median sale price of approximately $1,000,000–$1,180,000 (ARMLS, 2025) means that for most Los Angeles County and Inland Empire homeowners, Scottsdale is an equity-requiring move — not an equity-releasing one.
That changes sharply for Bay Area sellers. San Francisco Bay Area median prices in Q4 2025 reached approximately $1,200,000+ (CAR, 2025), with individual county medians substantially higher. A Santa Clara County or San Mateo County homeowner with equity in the $800,000–$1,400,000 range may find Scottsdale delivers not only a positive equity gap but a dramatic reduction in annual property carrying costs.
The ongoing property tax equation favors Scottsdale buyers regardless of origin market. Even at Scottsdale’s $1,000,000 price point, Arizona’s 0.52% effective rate produces an annual tax bill of approximately $5,200 — versus what a California homeowner would pay at 0.74% on an equivalent property ($7,400 per year). That $2,200 annual delta compounds meaningfully over a 10-year hold.
Scottsdale’s inventory expanded in 2025, reaching 4.8 months of supply — still a seller-leaning market overall, but with more options for buyers than the near-zero-inventory conditions of 2021–2022. Closed sales rose 5.7% year-over-year in the first 10 months of 2025 (ARMLS, 2025), indicating sustained transaction volume at the premium price tier.

Regardless of which Phoenix Valley community a relocating homeowner chooses, the property tax structure creates an ongoing financial advantage that compounds across the ownership horizon. This is not a one-time equity event — it is an annual cash flow improvement that California’s tax structure cannot match at the moment of a new home purchase.
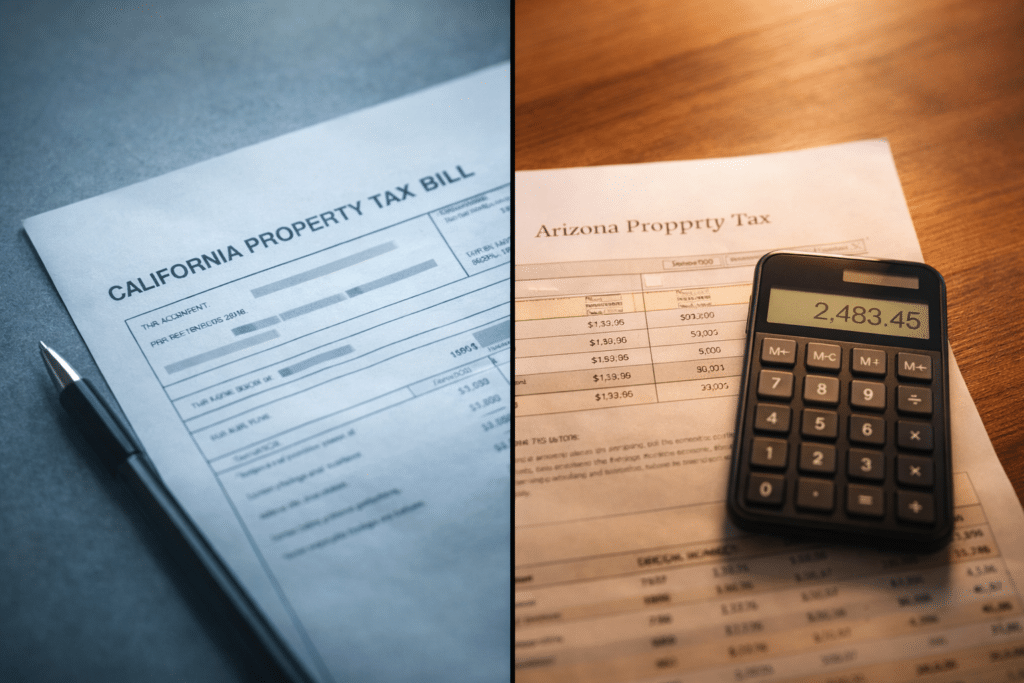
Maricopa County’s median effective property tax rate is 0.52% of assessed market value (Maricopa County Treasurer, FY2025). The county has reduced its primary property tax rate for four consecutive years, dropping from 1.40 in fiscal year 2021 to 1.16 in fiscal year 2025.
California’s effective property tax rate for a new purchaser runs approximately 0.74%–0.80% of purchase price (Tax Foundation State Tax Competitiveness Index). Because California’s Proposition 13 limits annual assessment increases for existing owners, the relevant comparison for a relocating homeowner is not the rate paid by a 20-year California resident — it is the rate they will pay on a new Arizona purchase vs. what they would have paid had they purchased a new California home.
Annual Bill: ~$2,860 10-Year Total: ~$28,600
Annual Bill: ~$6,290 10-Year Total: ~$62,900
Estimated 10-Year Tax Delta: ~$34,300 (Not adjusted for inflation or future assessment changes. For illustrative purposes only. Individual results will vary.)
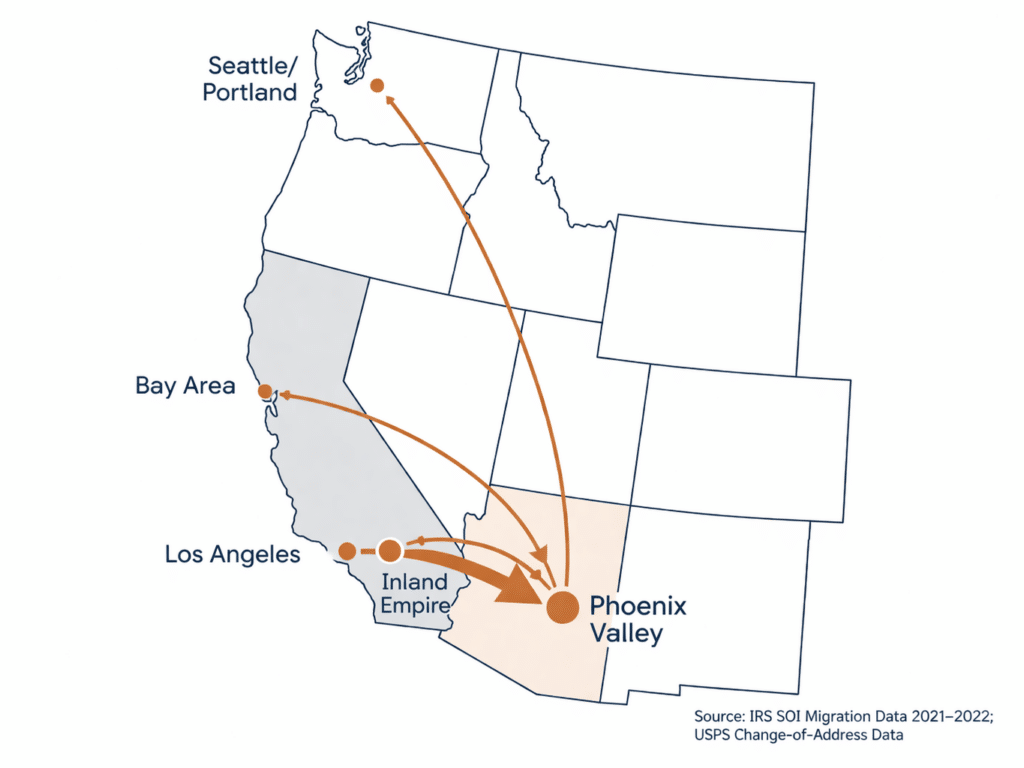
The IRS Statistics of Income Division migration data for the most recent available period (filing year 2021–2022) confirmed that among taxpayers with $200,000 or more in adjusted gross income, Arizona ranked among the top destination states for high-income outbound California filers (IRS SOI, 2024 Tax Foundation analysis). The tax structure differential is one of the documented drivers of that flow — alongside the home price gap that is the primary focus of this ranking.
West USA Realty advisors are available to walk through your specific equity and tax position at westusa.net
Migration data from the IRS Statistics of Income Division tracks address changes on individual tax returns — providing the most comprehensive financial picture of interstate relocation patterns available from a government source.
For filing year 2021–2022 (the most recently published IRS SOI migration dataset), California ranked among the top five states losing high-income filers — defined as taxpayers with adjusted gross income of $200,000 or more. Arizona ranked among the top destination states for that same income cohort. (Source: IRS Statistics of Income, 2021–2022 State Migration Data; Tax Foundation analysis, published December 2024.)
This is a financial migration pattern, not a demographic one. The IRS data capture movement of households and their associated income — confirming that the equity arbitrage thesis driving this ranking reflects real, measurable capital flows between states.
Maricopa County, which encompasses the Phoenix Valley, has been the largest-gaining county in the United States by raw population addition in multiple consecutive years (U.S. Census Bureau Population Estimates). The financial underpinning of that growth — home price differentials and tax structure — is exactly the arithmetic this ranking is designed to quantify.
USPS Change-of-Address data corroborate the directional flow, with net address forwarding from California ZIP codes to Arizona ZIP codes maintaining a sustained positive balance across the 2020–2025 period (USPS Change-of- Address data).
A1: West Valley communities — including Buckeye, Goodyear, and Surprise — offer the largest raw equity gap relative to California origin-market pricing. With median home prices in the $380,000–$430,000 range (ARMLS, 2025), a homeowner selling a Los Angeles County median home at $890,910 (CAR, December 2025) faces a price differential of approximately $460,000– $510,000, the widest in the Phoenix Valley. The trade-off is geographic distance from the Valley’s central employment core.
A2: Maricopa County’s median effective property tax rate is 0.52% of assessed market value (Maricopa County Treasurer, FY2025). For a California homeowner purchasing a new home, the effective rate runs approximately 0.74%–0.80% of purchase price (Tax Foundation, 2025). On a $550,000 Arizona home versus a $890,000 California equivalent, the annual tax differential can exceed $4,000 in the first year of ownership. This advantage exists in every Phoenix Valley community — it is not community-specific.
A3: In Gilbert, the 2025 median sale price was approximately $572,000 (ARMLS, 2025). A Los Angeles County homeowner with $575,000+ in net equity could purchase the median Gilbert home on an all-cash basis or with minimal financing. In Chandler, the 2025 median was approximately $545,000 — producing a comparable equity-to-price match for homeowners with equity in the $500,000+ range.
A4: Scottsdale operates in a different financial calculus than other Valley communities. The Scottsdale median sale price reached approximately $1,000,000–$1,180,000 in 2025 (ARMLS). For Bay Area homeowners with equity in excess of $1,000,000, Scottsdale offers a viable equity-to-price match. For most Los Angeles County and Inland Empire homeowners, Scottsdale requires additional financing — the move does not generate a positive equity gap but still delivers meaningful ongoing property tax savings and a substantially larger finished home for the dollar invested.
A5: The equity figures in this ranking represent gross home price differentials — the difference between your California sale price and the Arizona purchase price. Your actual retained equity depends on your remaining mortgage balance, selling costs (typically 5%–7% of California sale price), and federal capital gains tax on any appreciation above the $250,000 / $500,000 (married filing jointly) primary residence exclusion. This ranking is a starting framework.

Each Phoenix Valley community has its own equity analysis page with current ARMLS data, property tax breakdowns, and neighborhood-level price maps. Select your destination to run the numbers.
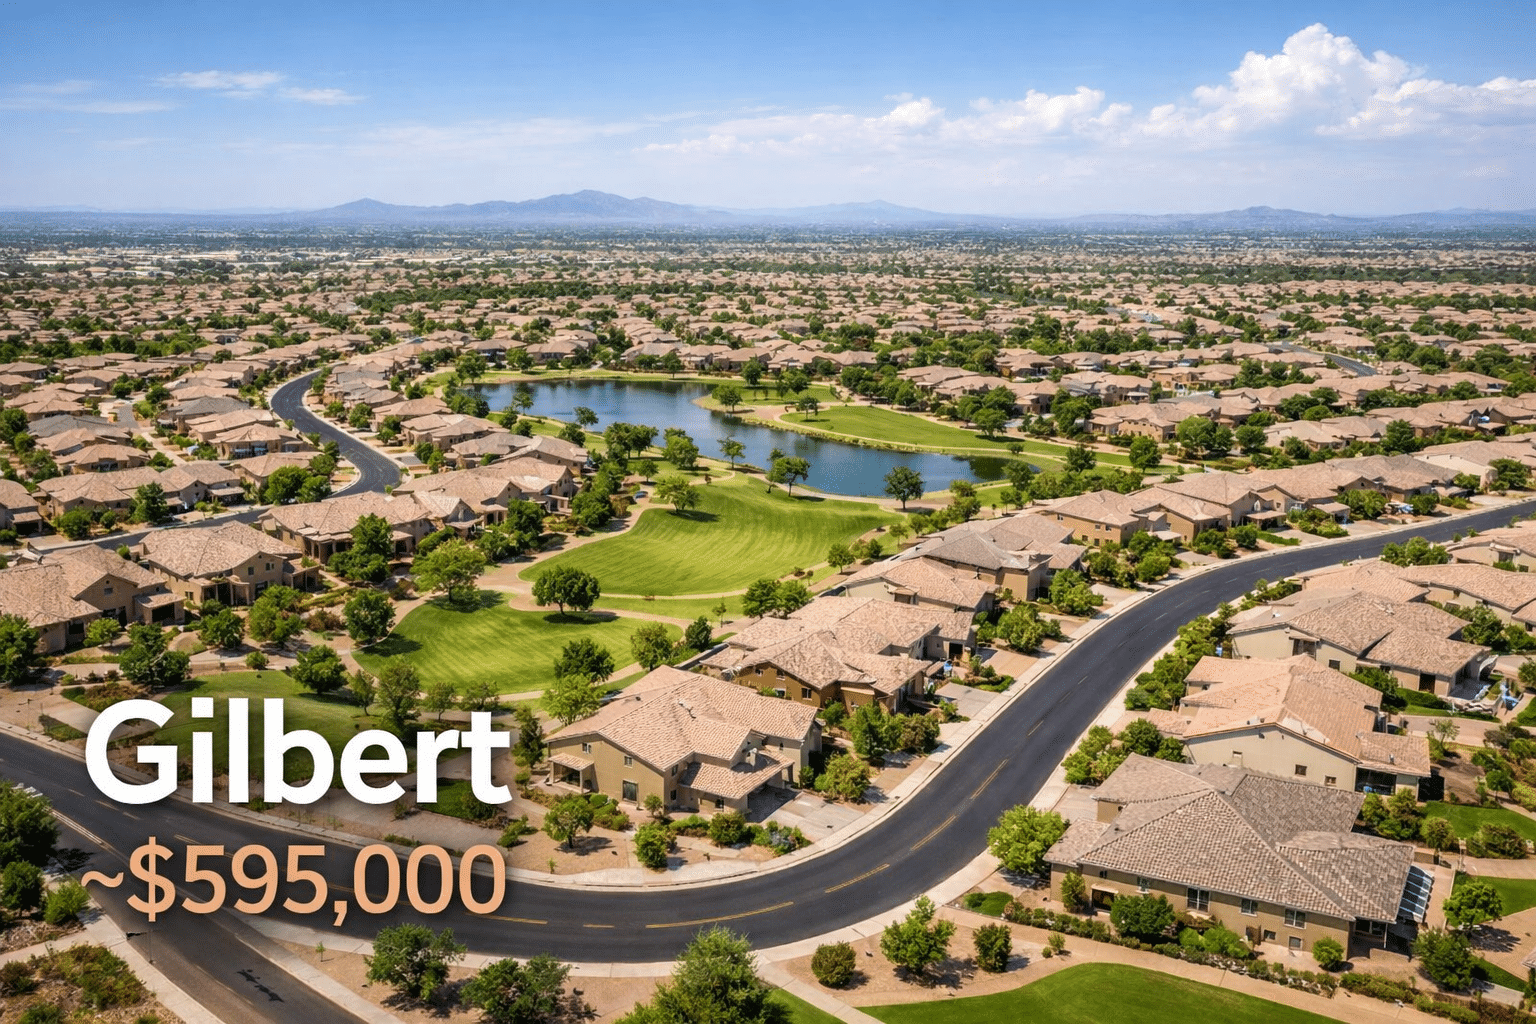
Median: ~$595,000 (2025 YTD)
Master-Planned Infrastructure
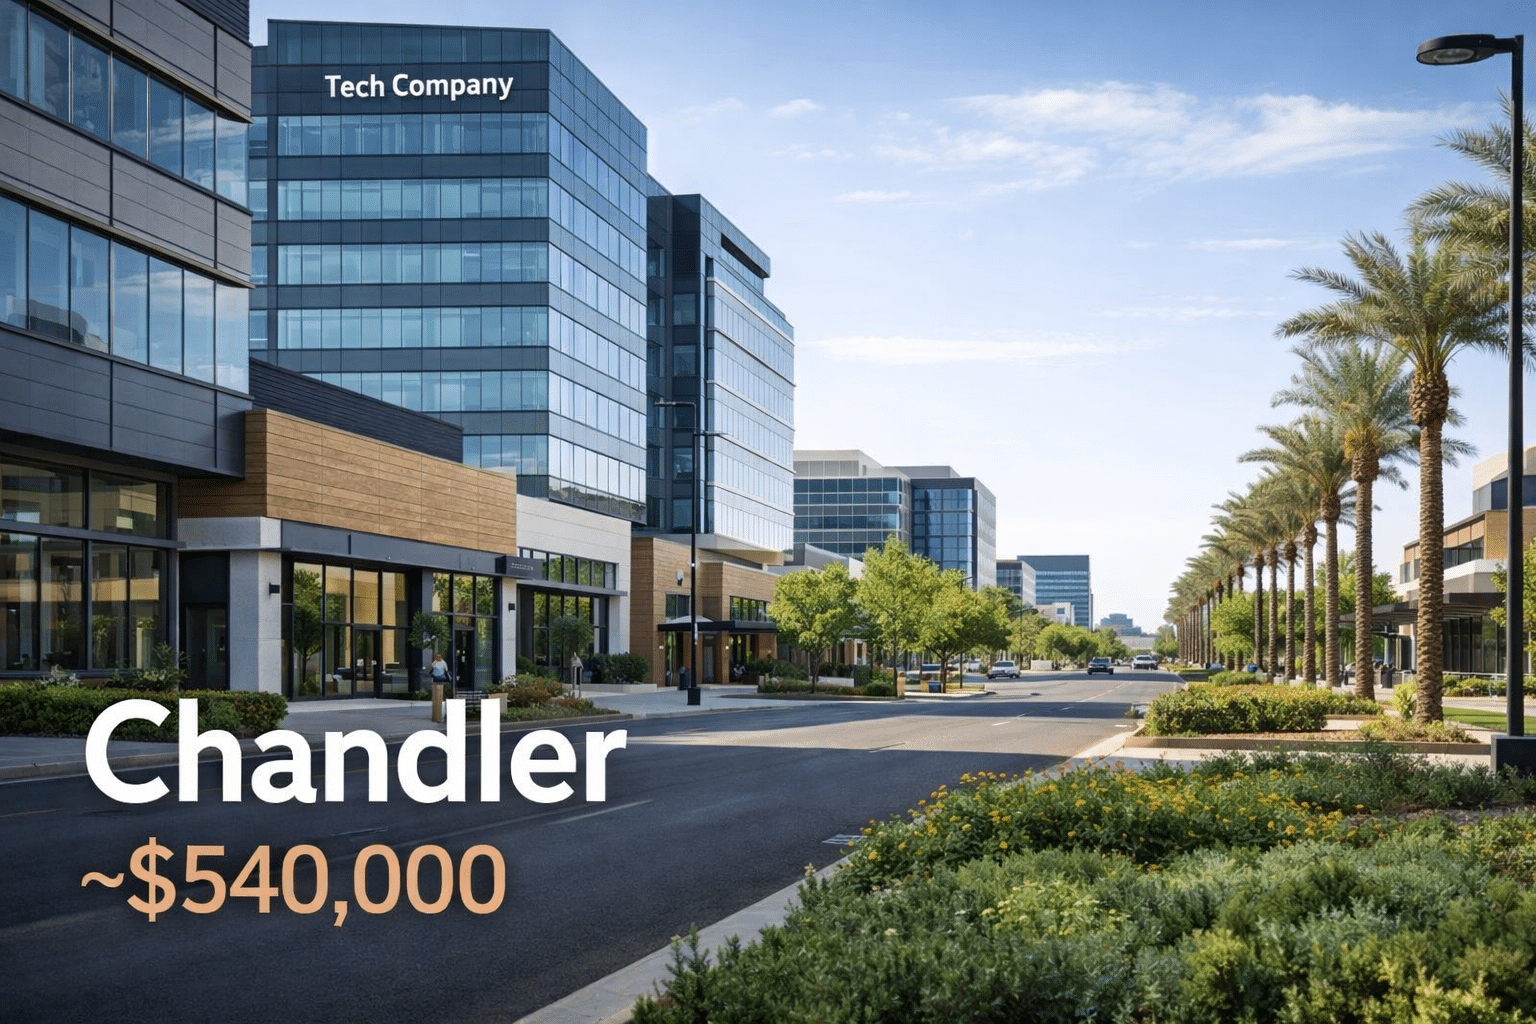
Median: ~$540,000
Employment Corridor Access
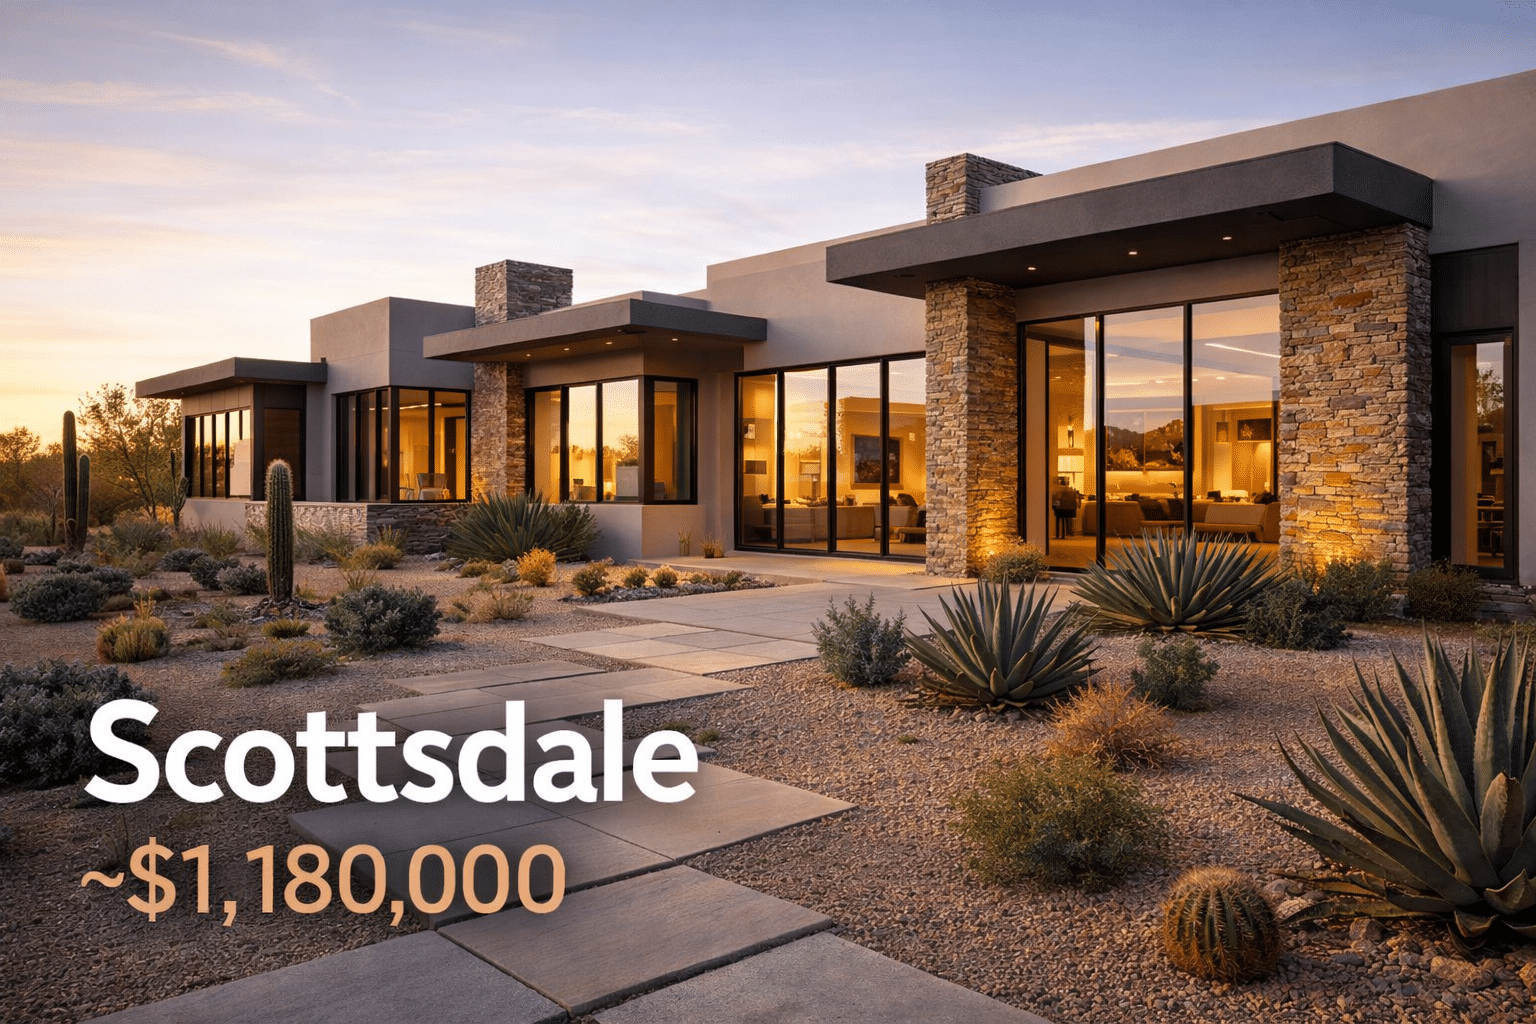
Median: ~$1,180,000 (2025 YTD)
Premium Equity Destination
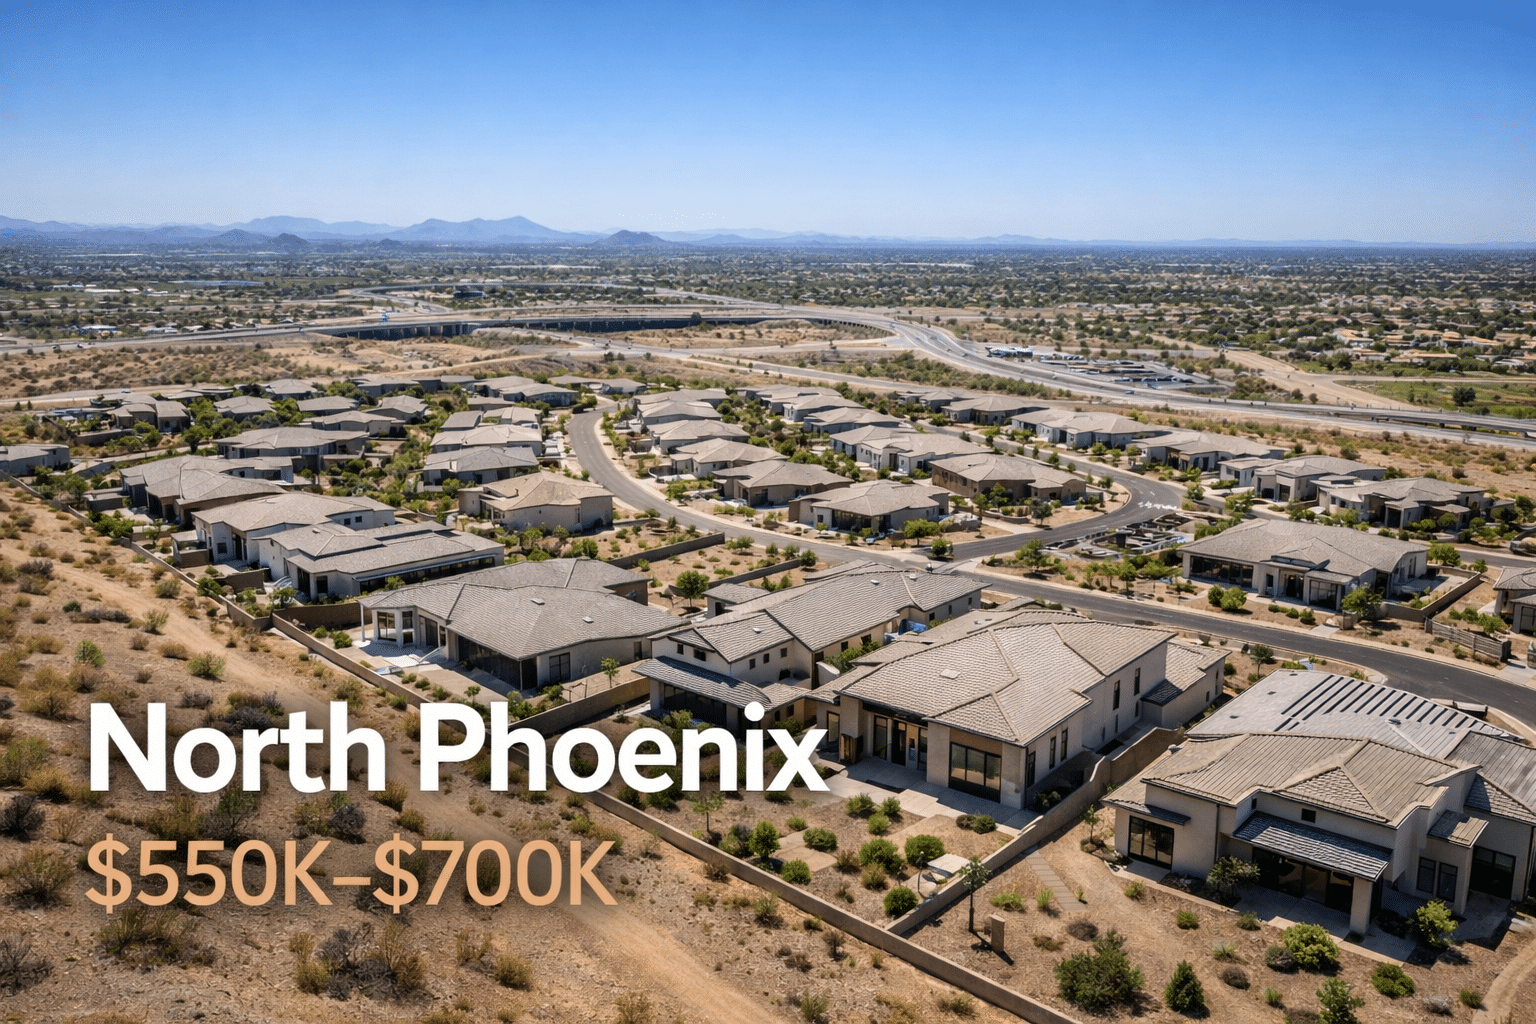
Range: ~$550,000–$700,000
Active Growth Corridor
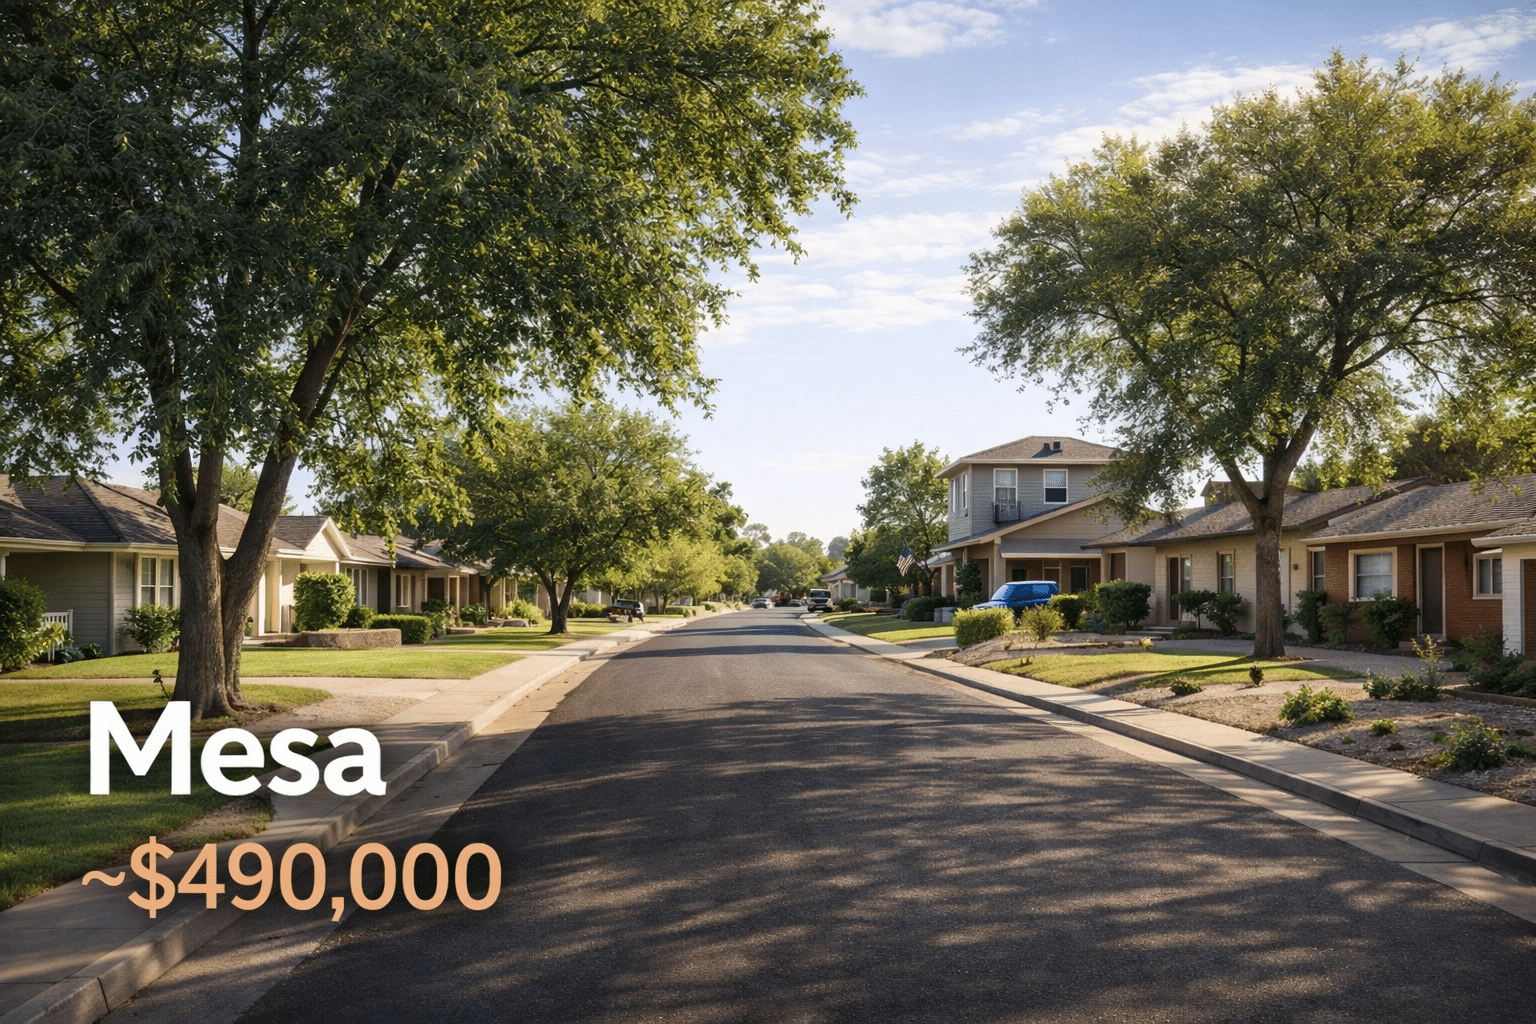
Median: ~$490,000 (2025)
East Valley Stability
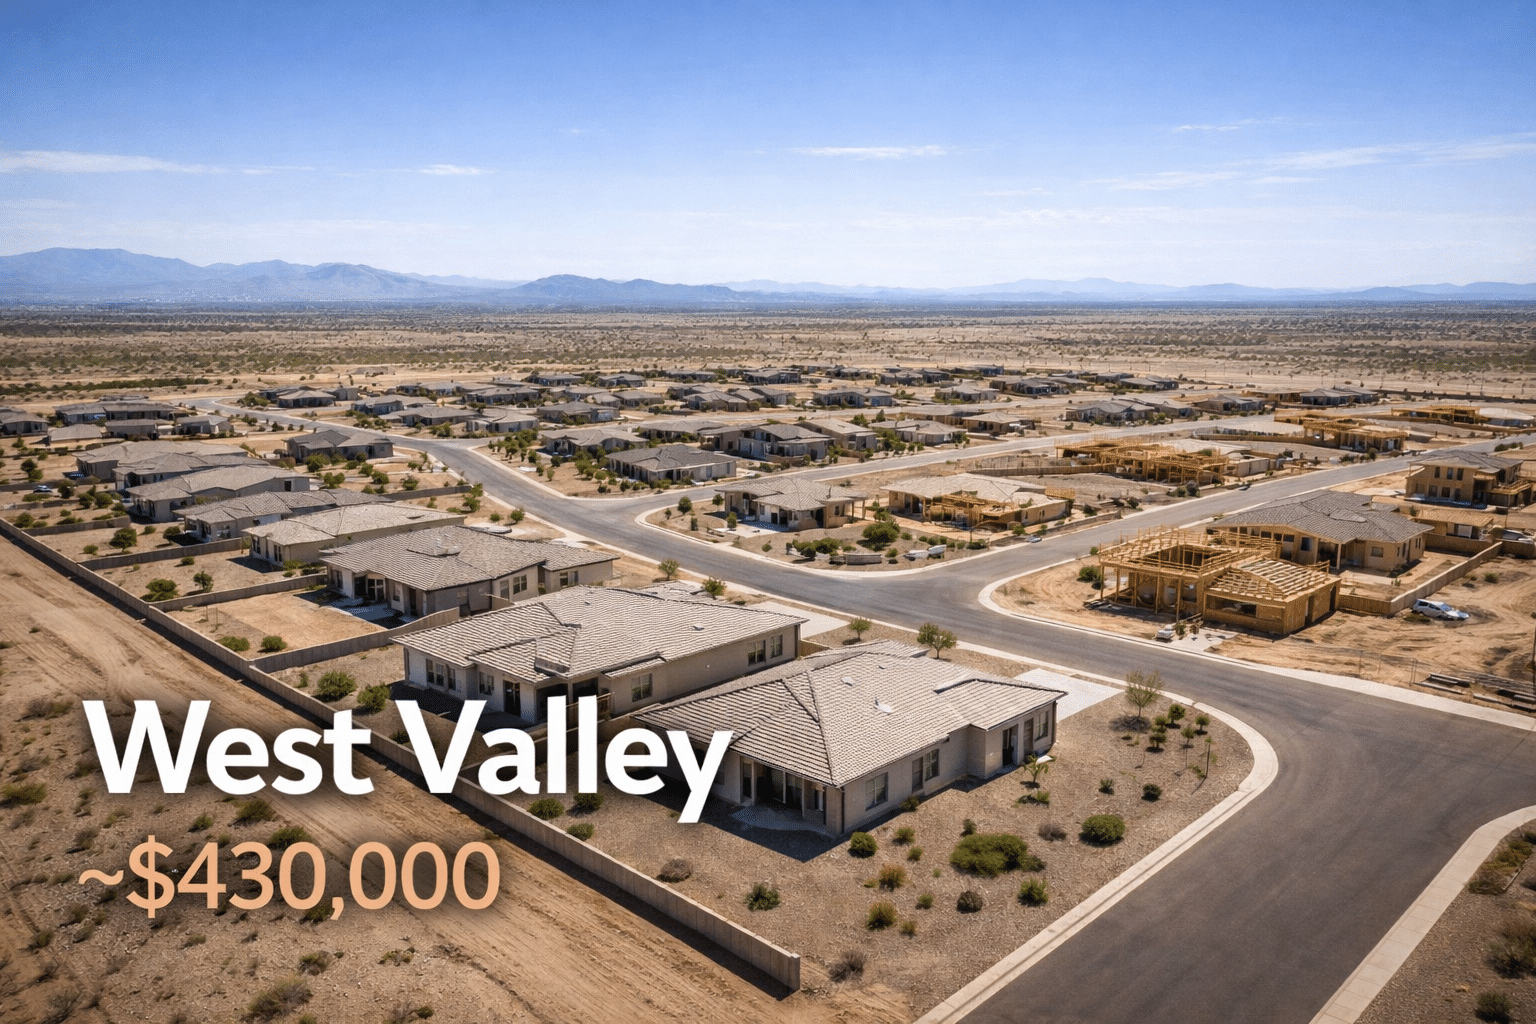
Median: ~$430,000
Widest Equity Gap