The Bureau of Economic Analysis calculates California’s statewide price level at 12.6% above the national average — the highest in the nation. Arizona runs near the baseline. For homeowners carrying California mortgage payments, the monthly delta when they buy in the Phoenix Valley isn’t a rounding error. It’s a structural financial shift.
Most cost-of-living comparisons collapse a complex financial picture into a single percentage. That headline is useful — but less useful when you’re making a seven-figure capital reallocation decision. This guide breaks the comparison into component parts: housing, property taxes, auto insurance, groceries, utilities, and the income-tax drag that often matters as much as the mortgage.
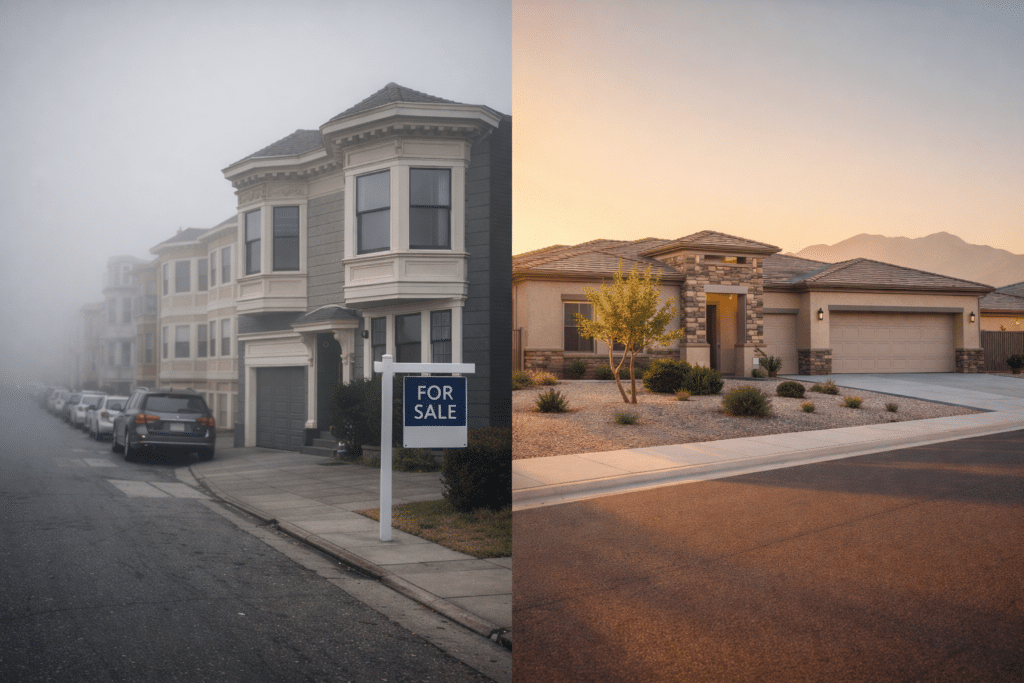
The dominant variable is housing. For high-equity California homeowners, cost-of-living arbitrage is not primarily about groceries or gas. It’s the monthly carrying cost of the next property relative to the equity freed up by the move. The other categories matter and compound, but housing is where the math is made.
One category reliably moves in Arizona’s direction: property tax. One category reliably moves against it: summer electricity. Both will be quantified here.
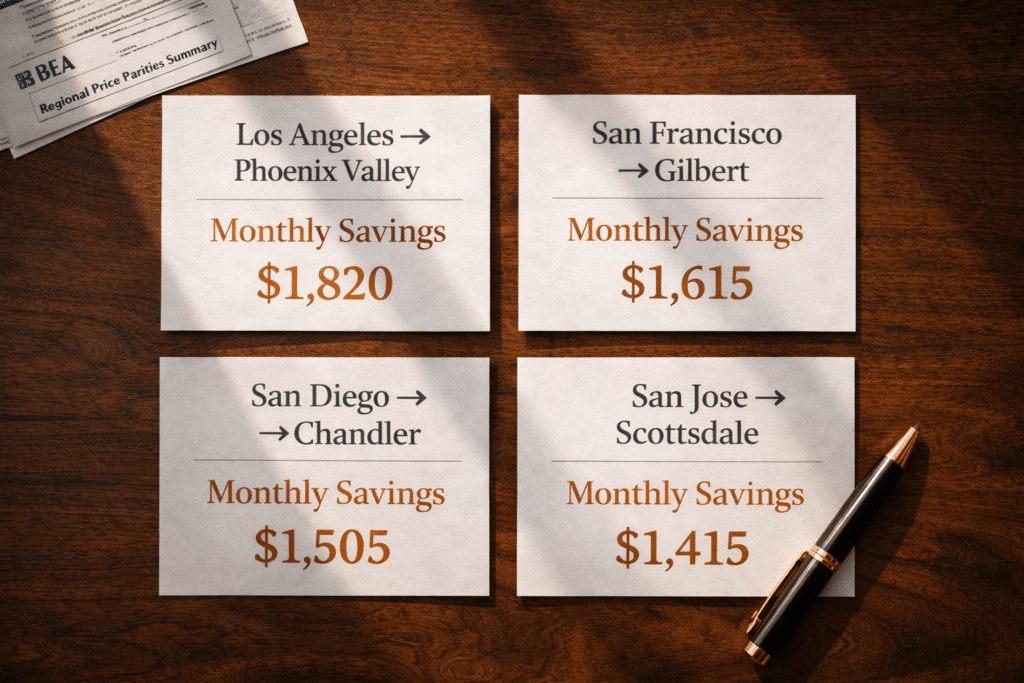
Four city-pair comparisons — Los Angeles → Phoenix, San Francisco → Phoenix, San Diego → Phoenix, and San Jose → Scottsdale — each with a line-by-line monthly expense breakdown using current market data
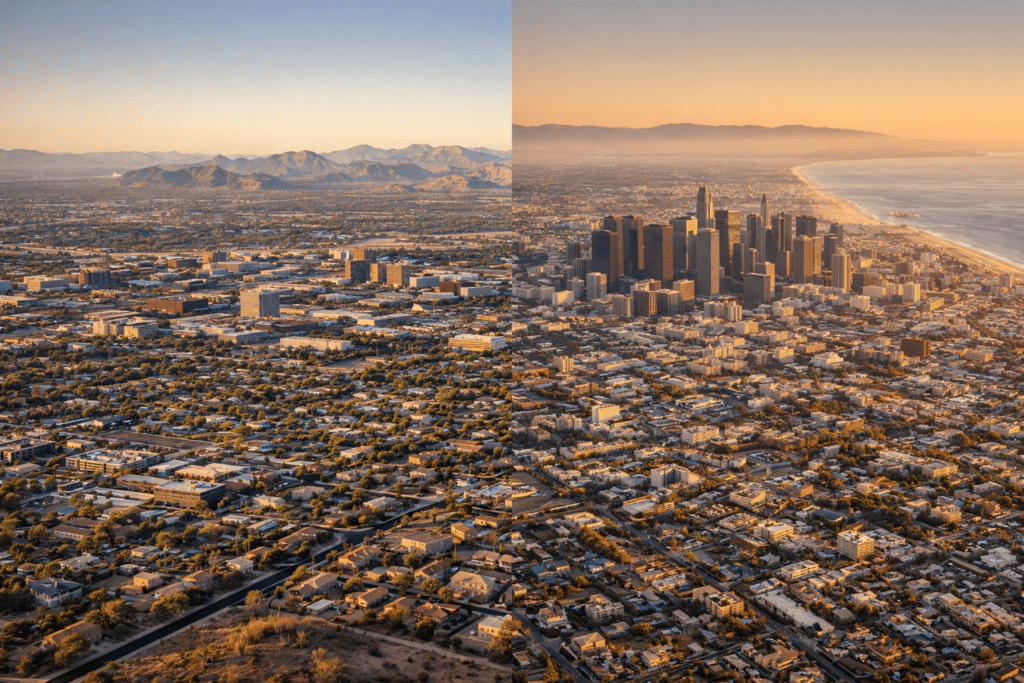
The LA-to-Phoenix corridor is the largest domestic equity migration route in the United States. IRS Statistics of Income data for the 2021–2022 filing year recorded 11,558 tax filers making this move — a net flow of +7,092 in Arizona’s favor. The monthly comparison below shows why.
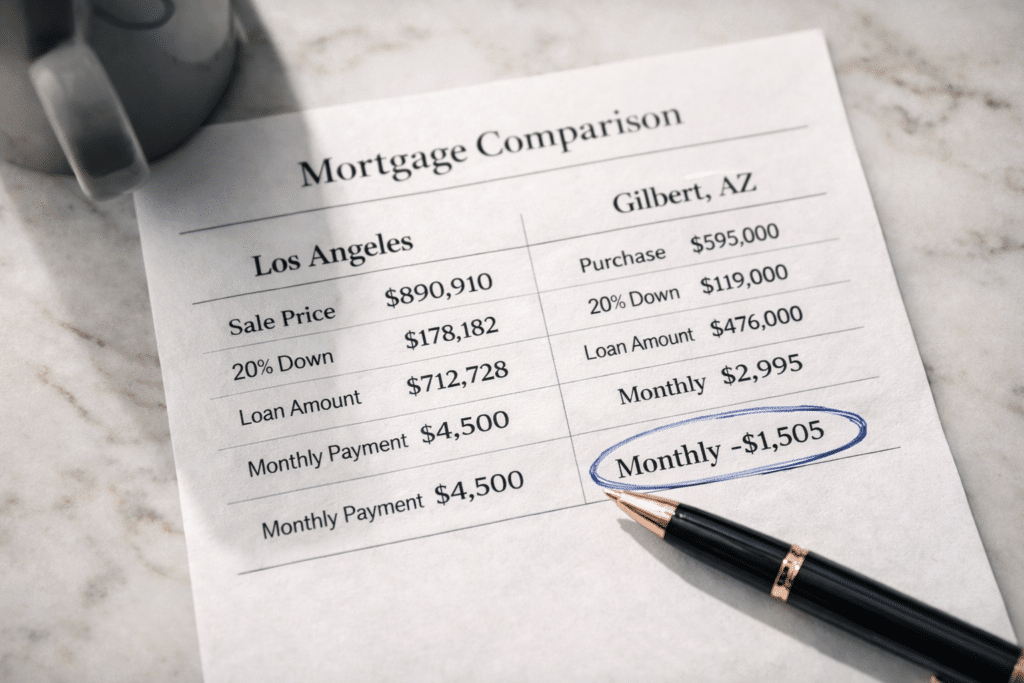
Base assumptions: LA County median home sale price $890,910 (C.A.R., December 2025). Greater Phoenix median $450,000 (ARMLS, November 2025). Mortgage rate 6.5%, 20% down on both.
The BLS Consumer Price Index for the Los Angeles metro advanced 3.0% year-over-year as of January 2026, running above the national average. That inflation pressure is embedded in the LA baseline across services and everyday spending and isn’t captured by mortgage math alone.
| Monthly Expense | Los Angeles | Phoenix Valley | Monthly Delta |
|---|---|---|---|
| Mortgage Payment (PITI base) | ~$4,500/mo | ~$2,850/mo | -$1,650 |
| State Income Tax (on $200K AGI) | ~$1,250/mo | ~$417/mo | -$833 |
| Property Tax (annual ÷ 12) | ~$330/mo | ~$195/mo | -$135 |
| Auto Insurance (avg annual ÷ 12) | ~$250/mo | ~$165/mo | -$85 |
| Summer Cooling (June–Sept avg) | N/A elevated summer | +$300/mo (seasonal) | +$300 (seasonal) |
| Estimated Monthly Savings | ~$2,400–$2,700/mo |
Sources: ARMLS Nov 2025; C.A.R. Dec 2025; Tax Foundation 2025; Maricopa County Treasurer; BLS Consumer Expenditure Survey. Mortgage assumes 6.5% and 20% down. Income tax estimate uses Tax Foundation rate guidance for a $200K household. Auto insurance uses BLS regional averages. Cooling reflects a seasonal Phoenix Valley estimate.
The Bay Area produces the steepest cost-of-living and equity gap in the California-to-Arizona migration system. Median home values exceed $1.2M and the income-tax differential is among the most consequential of any origin market.
Base assumptions: Bay Area home value $1,200,000. Greater Phoenix median $450,000 (ARMLS, November 2025). Scottsdale median ~$1,180,000 (ARMLS, 2025 YTD). Mortgage rate 6.5%, 20% do
A Bay Area seller purchasing at the Scottsdale median retains a premium destination match with the income-tax arbitrage intact. The equity unlocked is lower than Scenario A, but the annual state income tax savings on ~$200K AGI remain roughly $9,000–$10,000 per year regardless of Valley destination.
The BLS CPI for the San Francisco area recorded food prices up 4.3% year-over-year through December 2025, with grocery purchases up 5.7% and restaurant purchases up 2.9%.
California statewide: 112.6 | National baseline: 100.0
The San Francisco-Oakland-Hayward MSA is consistently among the top five most expensive MSAs in the nation by BEA metro-level price data.
| Monthly Expense | San Francisco Bay Area | Gilbert, AZ | Monthly Delta |
|---|---|---|---|
| Mortgage Payment (PITI base) | ~$6,060/mo | ~$2,995/mo | -$3,065 |
| State Income Tax (on $200K AGI) | ~$1,250/mo | ~$417/mo | -$833 |
| Property Tax (annual ÷ 12) | ~$380/mo | ~$258/mo | -$122 |
| Auto Insurance (avg annual ÷ 12) | ~$185/mo | ~$165/mo | -$20 |
| Summer Cooling (June–Sept avg) | N/A elevated summer | +$300/mo (seasonal) | +$300 (seasonal) |
| Estimated Monthly Savings | ~$3,700–$4,000/mo |
Sources: ARMLS Nov 2025; C.A.R. Dec 2025; Tax Foundation 2025; Maricopa County Treasurer; BLS Consumer Expenditure Survey. Mortgage assumes 6.5% and 20% down. Income tax estimate uses Tax Foundation rate guidance for a $200K household. Auto insurance uses BLS regional averages. Cooling reflects a seasonal Phoenix Valley estimate.
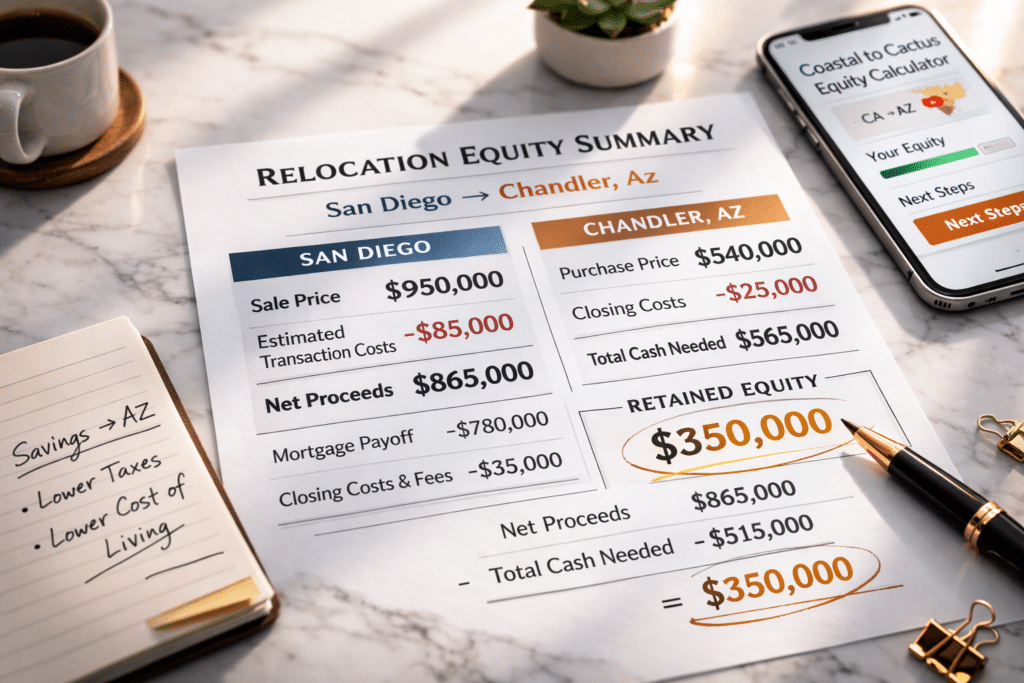
San Diego County contributed 8,433 residents to Arizona in the 2021–2022 IRS filing year — the second-largest California county migration flow. San Diego’s median sits below San Francisco but far above Greater Phoenix, producing a meaningful housing payment delta.
Base assumptions: San Diego median single-family ~$950,000 (C.A.R., 2025). Greater Phoenix $450,000 (ARMLS, Nov 2025). Chandler median ~$540,000. Mortgage rate 6.5%, 20% down.
A San Diego seller purchasing near the Chandler median typically retains an estimated $300,000–$360,000 in net equity after transaction costs, depending on actual sale price and closing terms.
| Monthly Expense | San Diego County | Chandler, AZ | Monthly Delta |
|---|---|---|---|
| Mortgage Payment (PITI base) | ~$4,793/mo | ~$2,717/mo | -$2,076 |
| State Income Tax (on $200K AGI) | ~$1,250/mo | ~$417/mo | -$833 |
| Property Tax (annual ÷ 12) | ~$360/mo | ~$234/mo | -$126 |
| Auto Insurance (avg annual ÷ 12) | ~$215/mo | ~$165/mo | -$50 |
| Summer Cooling (June–Sept avg) | N/A | +$300/mo (seasonal) | +$300 (seasonal) |
| Estimated Monthly Savings | ~$2,500–$2,800/mo |
Sources: C.A.R. 2025; ARMLS Nov 2025; Tax Foundation 2025; Maricopa County Treasurer; BLS Consumer Expenditure Survey.
Silicon Valley pricing routinely exceeds $1.4M for single-family homes. Even Scottsdale — the Valley’s premium destination at ~$1.18M — can represent a step-down for San Jose sellers, with income-tax savings layered on top. For buyers targeting Gilbert or Chandler instead, retained equity expands substantially.
Base assumptions: San Jose / Santa Clara median ~$1,500,000 (C.A.R., 2025). Scottsdale median ~$1,180,000 (ARMLS, 2025 YTD). Mortgage rate 6.5%, 20% down.
A San Jose seller purchasing in Gilbert at ~$595,000 retains an estimated $700,000–$760,000 in net equity after transaction costs, with the monthly mortgage payment dropping from roughly ~$7,572 to ~$2,995 (a ~$4,577/month housing delta alone).
$700,000–$760,000
Estimated net equity retained: San Jose median sale (~$1.5M) → Gilbert purchase ($595,000), after standard transaction costs.

| Monthly Expense | San Jose (Santa Clara Co.) | Scottsdale, AZ | Monthly Delta |
|---|---|---|---|
| Mortgage Payment (PITI base) | ~$7,572/mo | ~$5,952/mo | -$1,620 |
| State Income Tax (on $300K AGI) | ~$2,070/mo | ~$625/mo | -$1,445 |
| Property Tax (annual ÷ 12) | ~$540/mo | ~$511/mo | -$29 |
| Auto Insurance (avg annual ÷ 12) | ~$175/mo | ~$165/mo | -$10 |
| Summer Cooling (June–Sept avg) | N/A | +$300/mo (seasonal) | +$300 (seasonal) |
| Estimated Monthly Savings | ~$2,800–$3,100/mo |
Calculation based on C.A.R. and ARMLS medians, 6% transaction costs on CA sale + standard AZ closing costs.
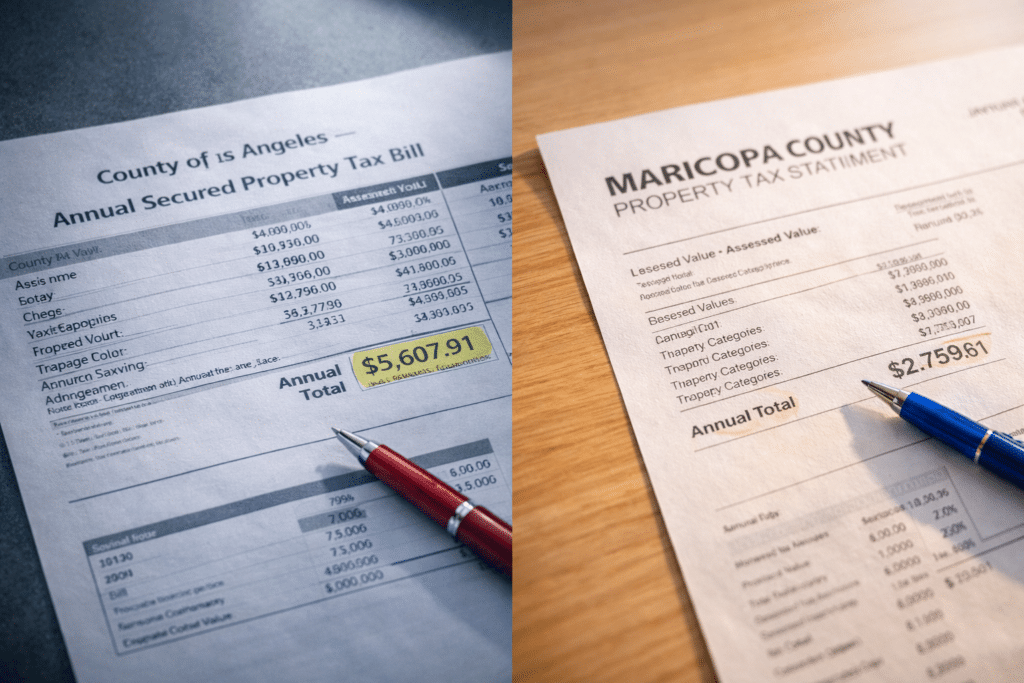
Proposition 13 caps assessed value increases while you hold a California property, but the protection ends the moment you sell. The next property is assessed at full purchase price. In Maricopa County, the effective property tax rate runs about 0.52%. Los Angeles County’s effective rate on assessed value runs about 0.73%, varying by district. On a $500,000 assessed value, the annual difference is roughly $1,050 (about $87.50/month).
At higher price points the gap widens. On a $900,000 property, the approximate difference between Maricopa (~$4,680/year) and LA County (~$6,570/year) is about $157/month.

This is the honest counterweight. Phoenix Valley summer cooling costs are real and should be planned for. A typical single-family home can see $250–$400/month electric bills from June through September. That’s a $1,000–$1,600 annual line item that many coastal California homeowners do not carry.
The offset is that California’s tiered electricity rates are among the highest in the nation and apply year-round. The Phoenix premium is concentrated in four months rather than embedded across twelve.
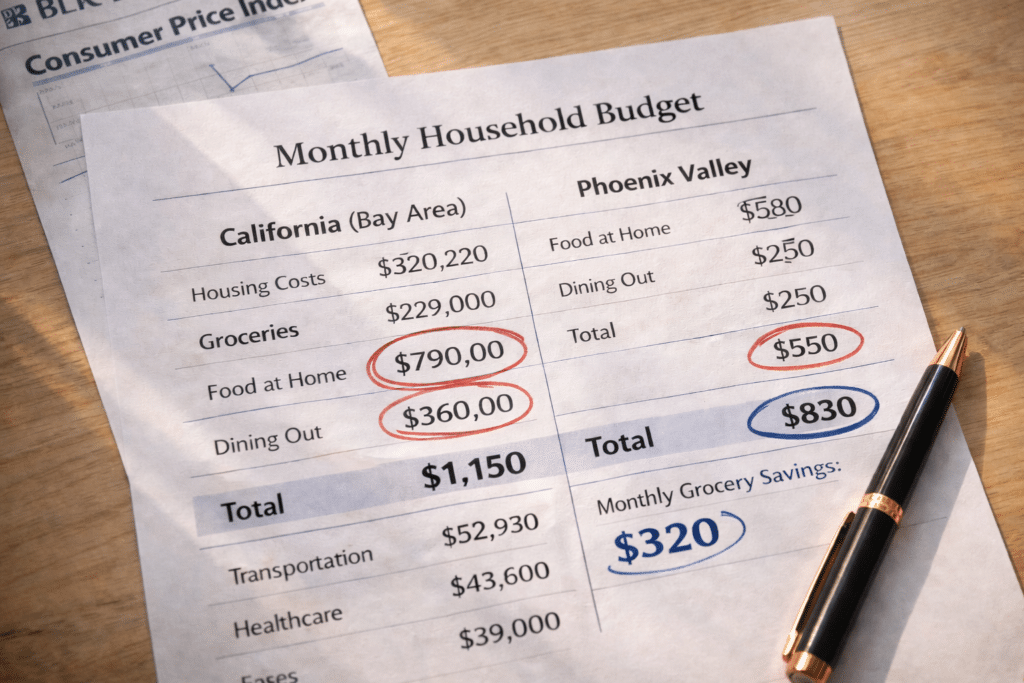
BLS CPI data shows food inflation in major California metros running above baseline in recent reporting periods (with San Francisco groceries notably elevated). Phoenix tracks closer to national averages in many day-to-day categories, though results vary by household spending pattern.
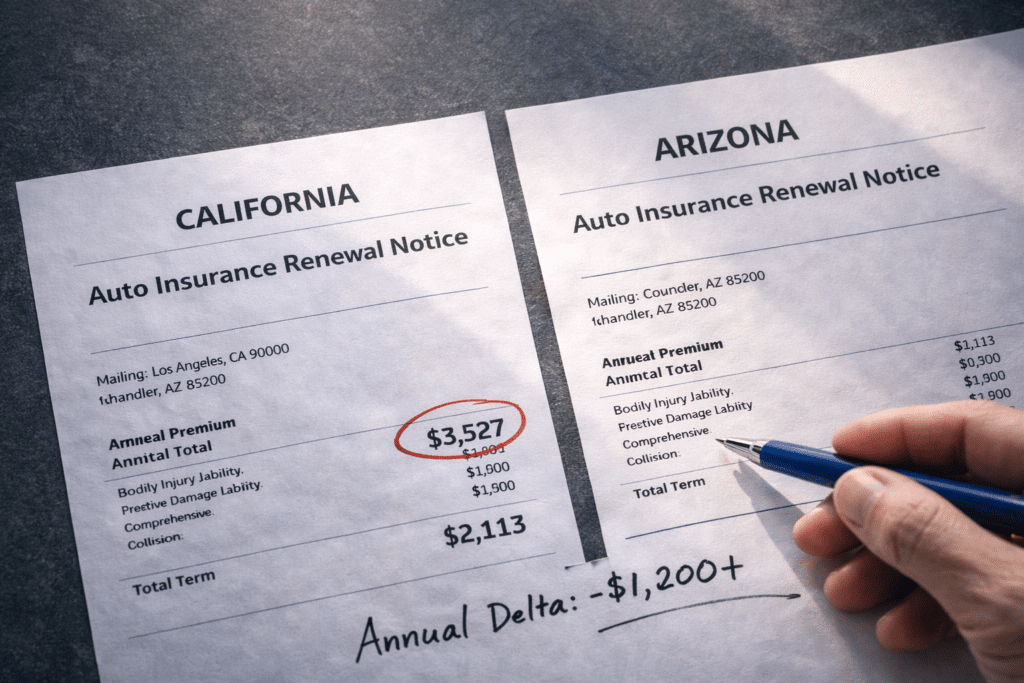
California’s auto insurance market operates under unique regulatory constraints and has historically produced higher premiums in major coastal metros. Arizona’s market is more price-competitive. BLS Consumer Expenditure Survey data reflects material regional variation, with Los Angeles and Bay Area insurance outlays typically above Southwest baselines.
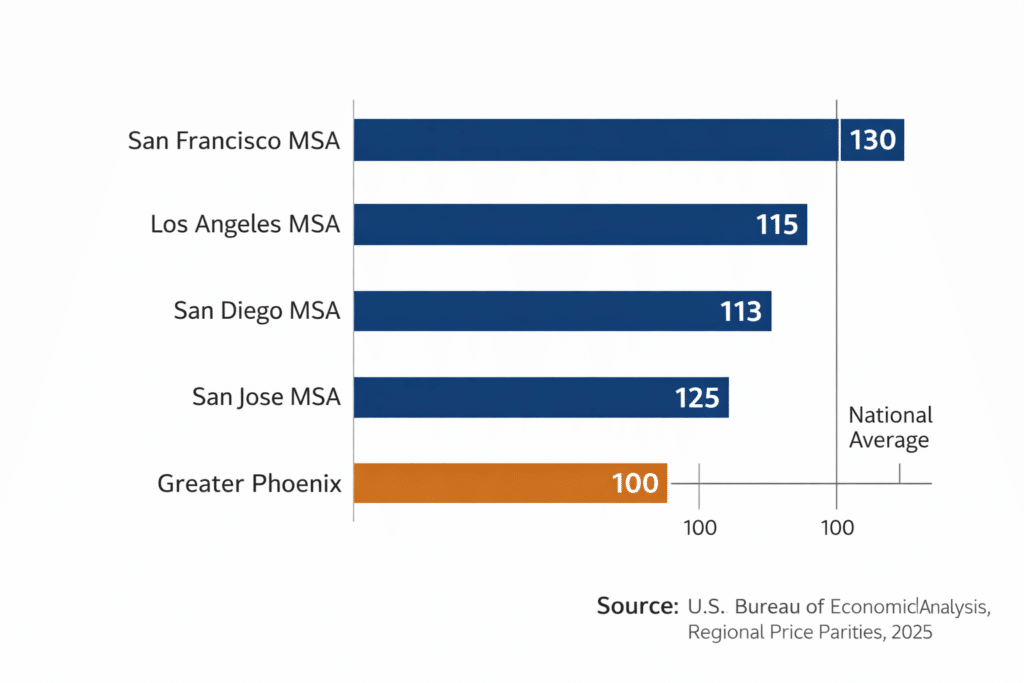
The Bureau of Economic Analysis Regional Price Parity (RPP) index is the most rigorous tool for comparing price levels across states and metro areas. RPPs measure differences in price levels as a percentage of the national price level (100 = national average).
Using BEA’s most recent RPP dataset (2023, released December 2024):
California statewide RPP: 112.6 (highest of any state).
California housing rents RPP: 157.8 (highest in the nation).
Arizona statewide RPP: near 100 (at or near national baseline).
If two households each earn $200,000 and one lives in California (RPP 112.6) while the other lives in Arizona (~100), the California household is effectively paying more for the same standard of living. For a household spending $120,000/year, a 12.6% premium implies roughly $15,000/year in additional purchasing-power cost — before factoring income tax differences.