The San Francisco Bay Area median home price closed December 2025 at $1,200,000, according to the California Association of Realtors. Greater Phoenix closed the same month at $450,000. That $750,000 spread is not a market curiosity it is a balance-sheet event. And the income tax structure you leave behind amplifies the math year after year.
No origin market in the country sends higher-equity homeowners to Arizona than the San Francisco Bay Area. The nine-county region sustained a December 2025 median of $1,200,000 for single-family homes, per California Association of Realtors data — and several individual counties sit dramatically above that figure. San Francisco County’s November 2025 median was $1,800,000. San Mateo County’s was $2,000,000. Santa Clara County’s was $1,935,250. These are not outlier markets. These are the median prices — the midpoints of what actual homes are selling for, right now.
Carry that equity into the Greater Phoenix market, where the ARMLS November 2025 median sits at $450,000, and the arithmetic is straightforward: a Bay Area seller at the regional median can purchase a comparable or larger home in Gilbert, Chandler, or North Phoenix and retain between $550,000 and $650,000 in net equity after standard transaction costs. A seller at the Santa Clara or San Mateo County median retains even more. This is the largest single-transaction wealth preservation event available to a California homeowner today.
The equity story doesn’t end at the closing table. A Bay Area household earning $300,000 per year pays an effective state income tax rate that can reach 10% to 12% on that income under California’s graduated structure, which tops out at 13.3% plus a 1.1% payroll surcharge for high earners. Arizona’s flat 2.5% rate on the same income produces a state tax bill roughly $22,000 to $27,000 lower annually. Over ten years, that delta compounds into $220,000 to $270,000 in cumulative savings capital that was previously being transferred to Sacramento every April.
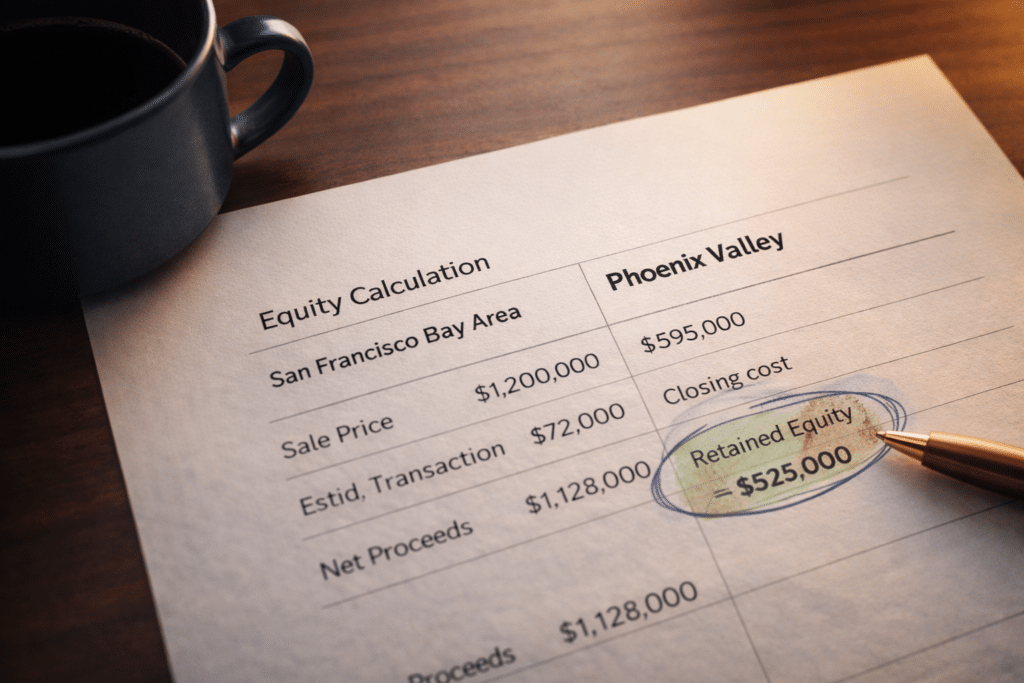
At the Bay Area regional median, a seller’s estimated net proceeds after transaction costs run approximately $1,100,000 to $1,130,000. The table below maps those proceeds against current Phoenix Valley inventory
Median: ~$595,000 (2025 YTD)
Estimated Equity Retained: ~$525,000--$535,000
Master-planned communities, HOA-maintained amenities (pools, parks, ramadas), strong new-construction pipeline.
Median: ~$540,000
Estimated Equity Retained: ~$580,000--$590,000
Tech-corridor proximity along the Price Road Corridor, established neighborhood inventory, mixed retail and employment base.
Median: ~$1,180,000 (2025 YTD)
Estimated Equity Retained: ~$0--$60,000 at the regional median; significant retained equity at Bay Area county-level medians
The Valley's premium positioning --- a comparable luxury market for sellers from San Mateo or Santa Clara County whose proceeds exceed $1.2M.
Range: ~$550,000--$700,000
Estimated Equity Retained: ~$410,000--$560,000
Newer builds along the Loop 101 and Loop 51 corridors. Large master-planned footprint with HOA-governed amenities.
Median: ~$490,000 (2025)
Estimated Equity Retained: ~$630,000--$640,000
Broad inventory spectrum from newer builds to established resale neighborhoods. Strong value proposition per square foot relative to the East Valley median.
Median: ~$430,000
Estimated Equity Retained: ~$685,000--$700,000
Maximum square footage per dollar in the Valley. Fastest-growing submarket by new-construction permit volume. Direct I-10 corridor access.
Price data: ARMLS, Phoenix REALTORS year-to-date 2025 reports. Equity retained estimates assume 6% transaction costs on Bay Area sale and standard Phoenix closing costs. Individual results vary based on actual sale price, loan payoff, and closing terms.
The pattern across every community is consistent: a Bay Area seller at or above the regional median can purchase at any Valley price point and retain six figures — in most cases, well into the mid-six figures — in net equity. A Santa Clara County seller at the county median of $1,935,250 who purchases in Gilbert at $595,000 retains approximately $1,200,000 in net proceeds after all transaction costs. That retained capital can eliminate a mortgage entirely, fund a renovation, or sit in a brokerage account generating returns that the equity could not produce locked inside four walls in Sunnyvale.
California’s income tax structure is the most consequential financial variable in the relocation equation for Bay Area homeowners. The state’s top marginal rate of 13.3% with an additional 1.1% payroll surcharge on incomes above $1 million is the highest in the nation. Arizona’s flat 2.5% rate applies to all income levels with no graduation and no surcharge. For a dual-income household earning $350,000, the annual state income tax delta between California and Arizona runs approximately $25,000 to $35,000 depending on deductions and filing status. That is not a rounding error. That is a second mortgage payment or the annual cost of a child’s college education returned to the household balance sheet every year.
One variable Bay Area sellers frequently underestimate: Proposition 13 creates a false sense of property tax security. Long-term Bay Area owners with assessed values far below market often carry annual property tax bills of $8,000 to $12,000 on homes now worth $1.5M to $2M — which feels manageable relative to the asset’s value. The moment the home sells, the Prop 13 umbrella closes. The next property, wherever it is, gets assessed at full purchase price. In Maricopa County, a full assessment at $600,000 generates an annual property tax bill of approximately $3,100 — a fraction of what Bay Area owners are already paying on capped assessments that haven’t kept pace with appreciation.

| Tax Category | California (SF) | Arizona (Maricopa Co.) |
|---|---|---|
| Top State Income Tax Rate | 13.3% (+ 1.1% surcharge) | 2.5% flat |
| Effective Property Tax Rate | ~0.65% (SF County) | ~0.52% (Maricopa Co.) |
| Transfer Tax on Sale | 1.5%–2.25% (SF tiered) | $2 per $1,000 (~0.2%) |
| State Income Tax on $300K AGI | ~$25,000–$28,000/yr | ~$7,500/yr |
| State Income Tax on $500K AGI | ~$47,000–$52,000/yr | ~$12,500/yr |
Sources: Tax Foundation, 2025 State Income Tax Rates; Maricopa County Treasurer; California Franchise Tax Board
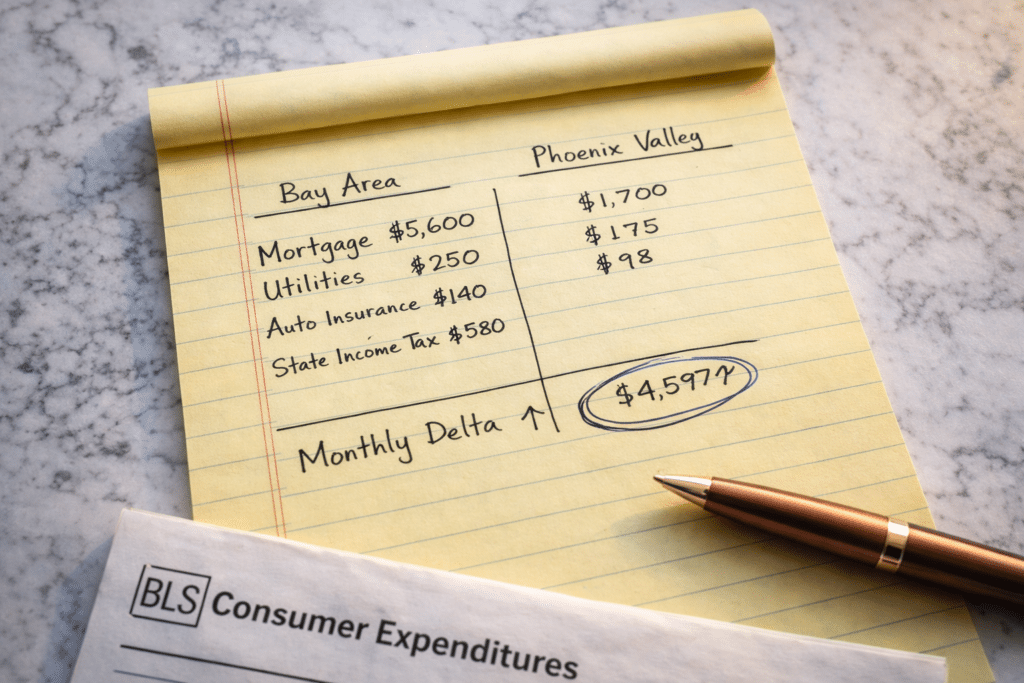
The San Francisco Bay Area runs approximately 80% above the national cost-of-living baseline, driven by housing costs but compounded across nearly every spending category, including auto insurance, groceries, utilities, and professional services. The Phoenix metro, per BLS Consumer Expenditure data, runs roughly 3% to 6% above the national average. The spread between those two figures roughly 74 to 77 percentage points represents the cost-of-living arbitrage available to a Bay Area homeowner who relocates.
The most immediate and measurable delta is the monthly mortgage payment. A household currently carrying a $5,600 per month payment on a $1.1M Bay Area home at 6.5% with 20% down could carry a comparable or larger home in Gilbert or Chandler at approximately $2,600 to $3,100 per month freeing up $2,500 to $3,000 in monthly cash flow. Over a decade, that reallocation represents $300,000 to $360,000 in capital that can be directed toward investment, accelerated mortgage paydown, or retirement accounts.
One category where Phoenix is not cheaper: summer cooling costs. Expect electric bills of $250 to $400 per month from June through September in a typical single-family home. Factor that in — but also factor in that Bay Area utility rates rank among the highest in the nation, and that the cooling premium is concentrated in four months rather than spread across the year.
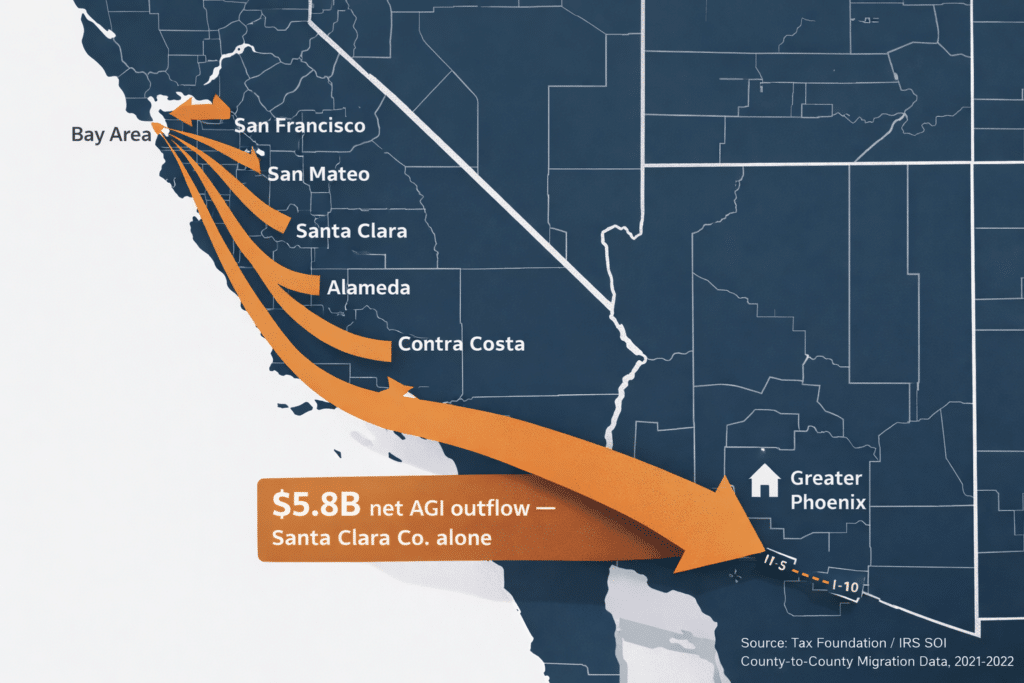
The Bay Area’s domestic outmigration story is most visible in the AGI data. According to Tax Foundation analysis of IRS Statistics of Income county-to-county migration data for the 2021–2022 filing year, Santa Clara County posted a net AGI loss of $5.8 billion through domestic outmigration the second-largest county-level AGI loss in the nation, trailing only Cook County, Illinois. This figure does not represent people leaving for lower-paying jobs elsewhere. It represents high-income households making calculated decisions to relocate capital to lower-tax, lower-cost environments. Arizona with its 2.5% flat income tax rate and Greater Phoenix median home prices at less than half of Bay Area norms is the dominant destination for that capital.
California as a whole posted a net loss of 144,203 income tax filers through domestic outmigration in the 2021–2022 IRS filing year, the largest state-level net loss in the country. Arizona captured a significant share of that flow: the IRS data show 57,857 total California-to-Arizona filers in that filing year, the single largest state-to-state migration corridor from California.
The income profile of Bay Area migrants distinguishes this corridor from others. IRS income bracket data show that migration in the $100,000–$200,000 income bracket — and above — is accelerating at a faster rate than any lower bracket. These are not distressed households. They are high-equity homeowners making deliberate financial decisions: liquidate an appreciating but yield-poor asset, reduce the annual tax drag on income, and redeploy capital into a market where it produces measurable, recurring financial advantages.
At the Bay Area regional median, a seller’s estimated net proceeds after transaction costs run approximately $1,100,000 to $1,130,000. The table below maps those proceeds against current Phoenix Valley inventory
November 2025 Median: $1,800,000
Sellers at the SF County median carry estimated net proceeds of approximately $1,690,000 to $1,710,000 after standard transaction costs. Against any Valley destination, the retained equity figure is transformational --- well into seven figures in most scenarios.
November 2025 Median: $2,000,000
The highest-median county in California. Net proceeds at the median run approximately $1,870,000 to $1,900,000. Purchasing in Scottsdale at $1,180,000 still retains $690,000 to $720,000 in net equity.
November 2025 Median: $1,935,250
Silicon Valley's core county. Net proceeds at the median run approximately $1,810,000 to $1,840,000. A purchase in Gilbert at $595,000 retains approximately $1,215,000 to $1,245,000 in equity --- a figure that, invested conservatively, generates more annual income than the property tax savings alone.
November 2025 Median: $1,192,500
Oakland, Berkeley, and the East Bay. At the county median, net proceeds run approximately $1,120,000 to $1,135,000. Full equivalency or better with the regional Bay Area figures outlined above.
November 2025 Median: $889,000
Walnut Creek, Pleasanton, Danville. The county's eastern position makes it the most price-accessible Bay Area submarket. Net proceeds at the median approximate $835,000 to $848,000. Retains six figures in equity against all Valley destinations.
Price data: California Association of Realtors, November 2025 Home Sales and Price Report. Net equity estimates assume 6% transaction costs on the Bay Area sale and standard Phoenix closing costs.