King County’s median single-family home closed at $887,300 in late 2025. The North Phoenix and Desert Ridge corridor — encompassing the active zip codes along the Loop 101 and I-17 interchange — runs $600,000 to $680,000 at the median for single-family homes. The spread between those two figures is the financial logic behind this page: a King County seller at or near the median can purchase in one of the Phoenix Valley’s fastest-growing new-construction corridors and still retain six figures in net equity after all transaction costs.
A King County homeowner selling at the October 2025 NWMLS-reported median of $887,300 carries estimated net proceeds of approximately $834,000 to $838,000 after standard transaction costs of roughly 6%. Purchasing at the North Phoenix / Desert Ridge median of approximately $630,000 — with standard Arizona closing costs of $10,000 to $14,000 — leaves an estimated $190,000 to $214,000 in retained equity. That figure is the starting point of the balance-sheet restructuring this move enables.
North Phoenix sits at the premium end of the Seattle-to-Phoenix destination spectrum. It is not where King County sellers go to maximize retained cash — that calculus favors Chandler or the West Valley. It is where King County sellers go when they want access to newer inventory, larger lots on the Valley’s northern fringe, and a price tier that represents a genuine upgrade in asset quality relative to what their King County proceeds purchased there. A King County household that owned a 1,700-square-foot home on a 4,500-square-foot lot can access a 2,600-to-3,200-square-foot home on a 7,500-to-10,000-square-foot lot in North Phoenix within a comparable dollar range — while retaining a six-figure cash reserve that did not exist before the sale.
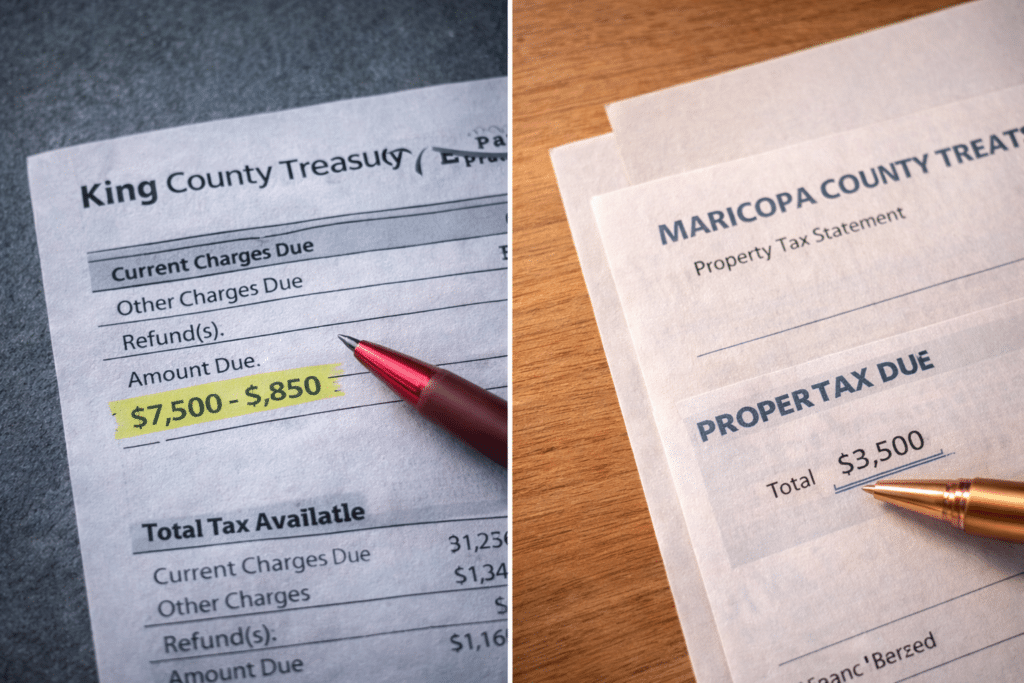
The annual property tax advantage follows immediately. King County’s effective property tax rate is approximately 0.92% (Washington State Department of Revenue, 2025). Maricopa County’s effective rate runs approximately 0.52% (Maricopa County Treasurer, 2025). On a $630,000 North Phoenix purchase, that produces an annual property tax bill of approximately $3,276 — compared to approximately $8,163 on a $887,300 King County home. The annual difference is approximately $4,887. Over a decade, before accounting for assessed-value growth on either side, that delta compounds into nearly $49,000 in cumulative property tax savings on the new asset alone.
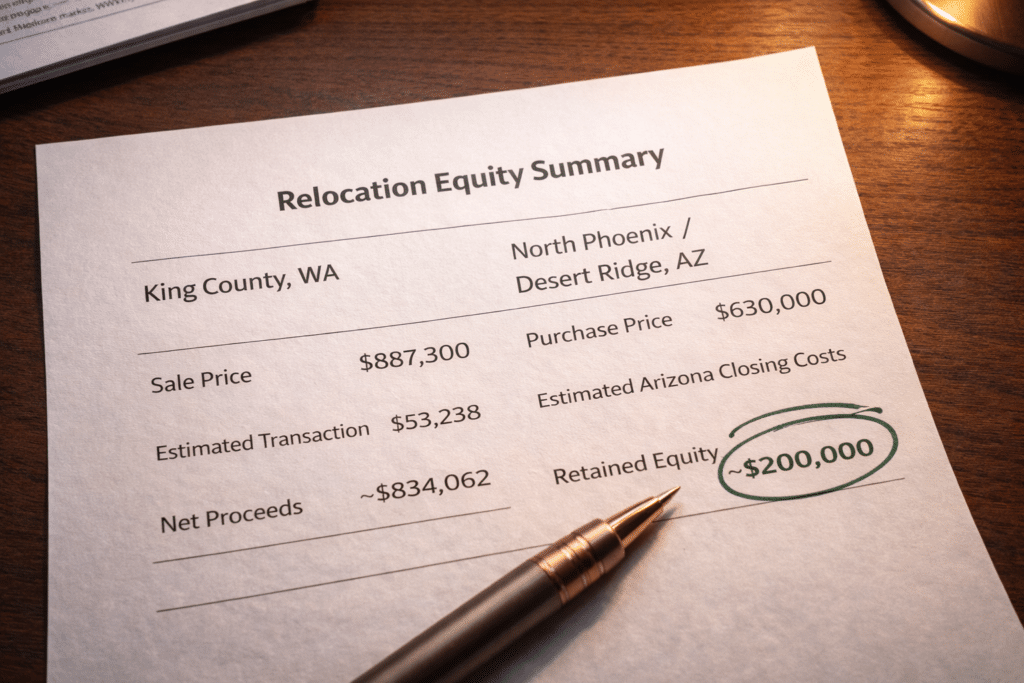
Estimated retained equity for a King County seller purchasing at the North Phoenix / Desert Ridge median (~$630,000), after standard transaction costs on both sides.
Calculation: NWMLS October 2025 median ($887,300) minus estimated 6% transaction costs = ~$834,000 net proceeds; minus North Phoenix median purchase price (~$630,000) and standard AZ closing costs (~$10,000–$14,000)
North Phoenix / Desert Ridge single-family home price range, 2025 YTD. Median for the primary new-construction corridor (zip codes 85054, 85085, 85086) runs approximately $600,000–$680,000.
Sources: ARMLS / Phoenix REALTORS 2025 annual data; FlexMLS submarket data
A King County seller at the $887,300 median carries approximately $834,000 in estimated net proceeds into the North Phoenix market. The table below maps those proceeds against the active North Phoenix / Desert Ridge price tiers as of 2025.
| Price Tier | Est. Sq Footage | Est. Lot Size | Est. Equity Retained |
|---|---|---|---|
| $500,000–$575,000 | 2,000–2,600 sf | 6,000–8,000 sf | ~$247,000–$322,000 |
| $575,000–$650,000 | 2,400–3,200 sf | 7,000–10,000 sf | ~$172,000–$247,000 |
| $650,000–$750,000 | 2,900–3,800 sf | 8,000–12,000 sf | ~$72,000–$172,000 |
| $750,000–$900,000 | 3,400–4,500 sf | 9,000–14,000+ sf | ~$0–$72,000 |
A King County seller at $1.0M to $1.1M — common in areas like Bellevue, Redmond, or Kirkland — carries approximately $940,000 to $1,034,000 in net proceeds and can access North Phoenix inventory in the $700,000 to $900,000 range while retaining $100,000 to $300,000 in cash. That tier of North Phoenix inventory delivers homes of 3,400 to 4,500 square feet on generously sized lots — a fundamentally different physical asset than what the same dollar produced in King County.
Price and square footage ranges: ARMLS / FlexMLS North Phoenix submarket data, 2025. Equity retained estimates assume ~$834,000 in net proceeds from King County sale and standard Arizona closing costs.
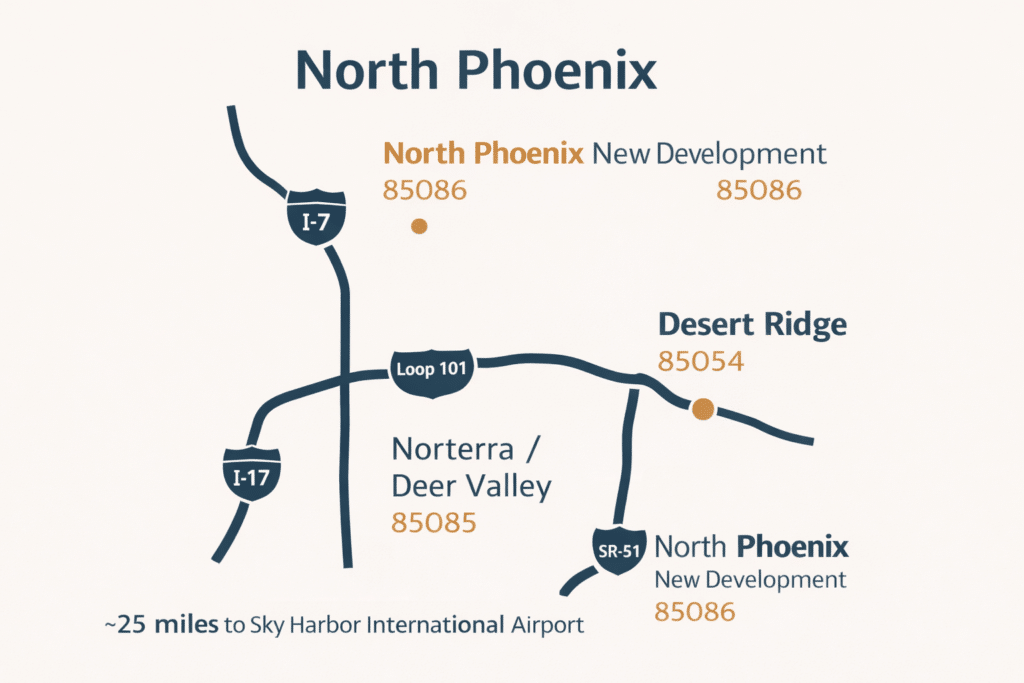
The North Phoenix and Desert Ridge market encompasses a broad arc of development running along the Loop 101, I-17, and State Route 51 interchange corridors — from the Desert Ridge Marketplace area (zip 85054) north through the Norterra and Deer Valley developments (zips 85085, 85086) and into the newer communities approaching Carefree Highway (zip 85086, 85087). This corridor is defined by its construction timeline, its freeway infrastructure, and its position as one of the most actively developing residential zones in the Phoenix Valley.
Median sold price (2025 corridor range): $600,000–$680,000 Broader North Phoenix submarket median (2025): approximately $510,000–$550,000 (wider geographic area including older inventory to the south) Median days on market: approximately 51–66 days depending on submarket and price tier (2025 data, ARMLS / FlexMLS) Build-out status: Active — mix of established resale inventory (2000s–2015 builds) and ongoing new construction in communities like Union Park at Norterra and Desert Ridge reserve parcels HOA infrastructure: Present across the majority of master-planned inventory; documented amenities in active communities include community pools, park areas, ramadas, and trail access to the adjacent Sonoran Preserve Primary freeway access: Loop 101 (east-west), I-17 (north-south), and SR-51 (southeast connection to central Phoenix) — among the best-connected freeway positions in the Valley Distance to Sky Harbor International Airport: approximately 25 miles south via Loop 101 / SR-51
The area around the Loop 101 and SR-51 junction was identified by Phoenix REALTORS as one of the top three highest-performing submarkets in the Phoenix metro in 2024, recording a 14.8% year-over-year gain in median sale price. The Deer Valley corridor along I-17 and Loop 101 ranked second in the metro for year-over-year closed and pending sales growth heading into 2025, according to Phoenix REALTORS annual data. That transaction momentum reflects continued buyer demand for newer-build inventory at a price tier that is accessible to equity-rich relocators but remains below the Scottsdale premium.
Median sold price range for single-family homes in the North Phoenix / Desert Ridge primary corridor (zip codes 85054, 85085, 85086), 2025.
Source: ARMLS / FlexMLS submarket data, 2025

Washington has no state income tax on wages — a structural advantage that can make King County homeowners underestimate the full tax picture of their current position. But property taxes in King County are among the highest effective rates in the Pacific Northwest, and the dollar amounts on mid-to-upper-tier homes are significant. For a homeowner selling at the King County median, the annual property tax savings in Maricopa County compound into a material sum over any holding period.
Washington’s capital gains excise tax, enacted in 2021 at a 7% rate on long-term gains exceeding $250,000, is particularly relevant for King County homeowners who have held their primary residence for a decade or more and may be liquidating investment accounts alongside the home sale. A household realizing $350,000 in long-term capital gains from a brokerage account in the same tax year as their home sale faces a Washington capital gains liability of approximately $7,000 on the amount above the $250,000 threshold. Establishing Arizona residency before triggering those gains eliminates that liability entirely, since Arizona taxes capital gains as ordinary income at the 2.5% flat rate. For households with material investment portfolios alongside their home, the timing of the move relative to asset liquidation is worth modeling with a tax advisor before closing.
| Tax Category | King County, WA | Maricopa Co., AZ |
|---|---|---|
| Effective Property Tax Rate | ~0.92% | ~0.52% |
| Annual Tax on $887,300 (KC med) | ~$8,163/yr | N/A |
| Annual Tax on $630K (NP median) | N/A | ~$3,276/yr |
| Annual Property Tax Delta | --- | ~$4,887 savings/yr |
| Cumulative 10-Year Delta | --- | ~$48,870 savings |
| WA Capital Gains Excise Tax | 7% on gains >$250K | Not applicable |
| AZ State Income Tax | N/A | 2.5% flat |
Sources: Washington State Department of Revenue, 2025; Maricopa County Treasurer, 2025; Tax Foundation, 2025 State Tax Rates
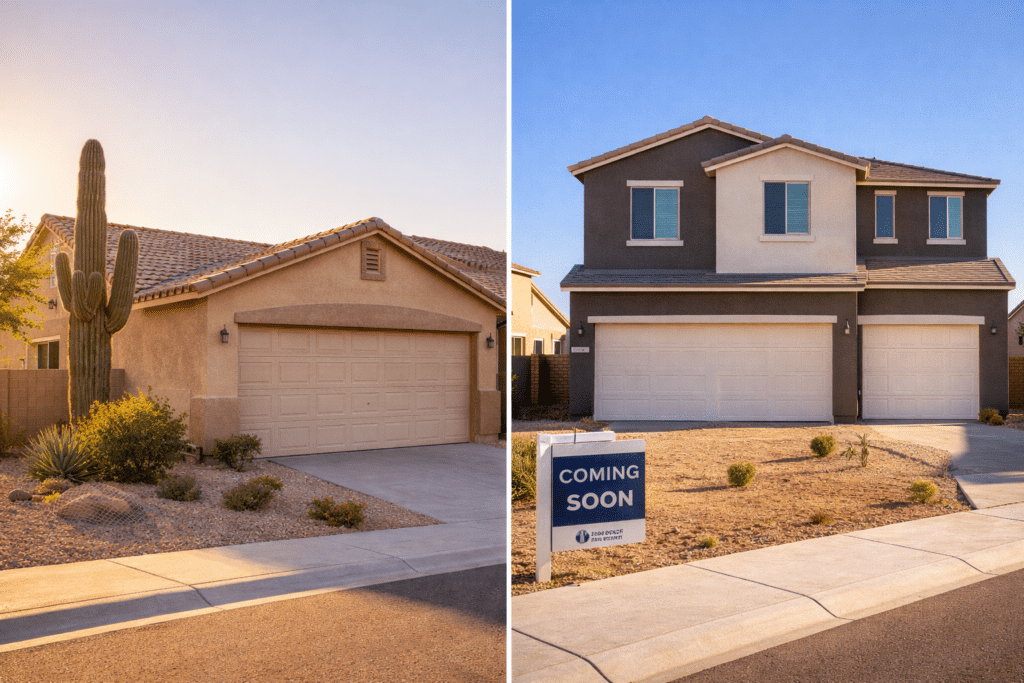
North Phoenix is one of the few Phoenix Valley submarkets where a relocating buyer from King County can meaningfully choose between purchasing established resale inventory and purchasing into active new-construction communities. That choice carries financial implications worth understanding before entering the market.
Resale inventory in the North Phoenix / Desert Ridge corridor — primarily 2000s to 2015 builds — is priced in the $550,000 to $700,000 range for single-family detached homes in the 2,200 to 3,200 square foot range. These homes offer established landscaping, completed HOA infrastructure, and in many cases, upgrades and renovations already absorbed by the prior owner. The resale market in this corridor has seen median days on market in the 55-to-66-day range in 2025, indicating adequate time for due diligence without the extreme multiple-offer pressure of 2021–2022.
New construction in active communities such as Union Park at Norterra and newer desert-edge developments is priced from the mid-$500,000s into the $900,000s depending on plan size and lot selection. Builder incentives — rate buydowns, closing cost contributions, and design center credits — have been active in this corridor through much of 2025 as builders work to absorb elevated inventory. For a King County seller arriving with cash proceeds and no contingency on the purchase side, builder incentives represent a direct increase in retained value that is worth quantifying against each community’s current offering structure. West USA Realty agents active in this corridor can provide current incentive details at the time of a buyer consultation.
Washington state ranks as the second-largest origin state for Arizona-bound migration in the IRS Statistics of Income data. In the 2021–2022 filing year, 16,600 Washington state tax filers relocated to Arizona — placing Washington behind only California among all 50 states as a source of new Arizona residents. Arizona’s net domestic migration gain that year was 36,714, ranked seventh nationally, and Washington households accounted for a structurally meaningful share of that inflow.
The income profile of Washington-origin migrants is relevant context for the North Phoenix market specifically. Washington residents who relocate tend to carry above-average adjusted gross income relative to the national migrant population, reflecting the concentration of higher-earning households in the greater Puget Sound corridor. That income profile corresponds directly to North Phoenix’s price tier, which sits above the Valley median and attracts buyers who are optimizing for asset quality and newer construction rather than maximum equity retention. The North Phoenix / Desert Ridge corridor is, in other words, a natural destination tier for the King County seller who wants to redeploy equity into a premium new-build environment rather than simply extract the largest possible cash position from the transaction.
Phoenix REALTORS data identified the Loop 101 / I-17 and Deer Valley corridor as the second-highest submarket in the Phoenix metro for year-over-year closed and pending sales growth heading into 2025. Transaction momentum in this corridor is not incidental — it reflects durable demand from equity-rich buyers who have identified North Phoenix as the premium tier that their King County proceeds can access without reaching into Scottsdale pricing.
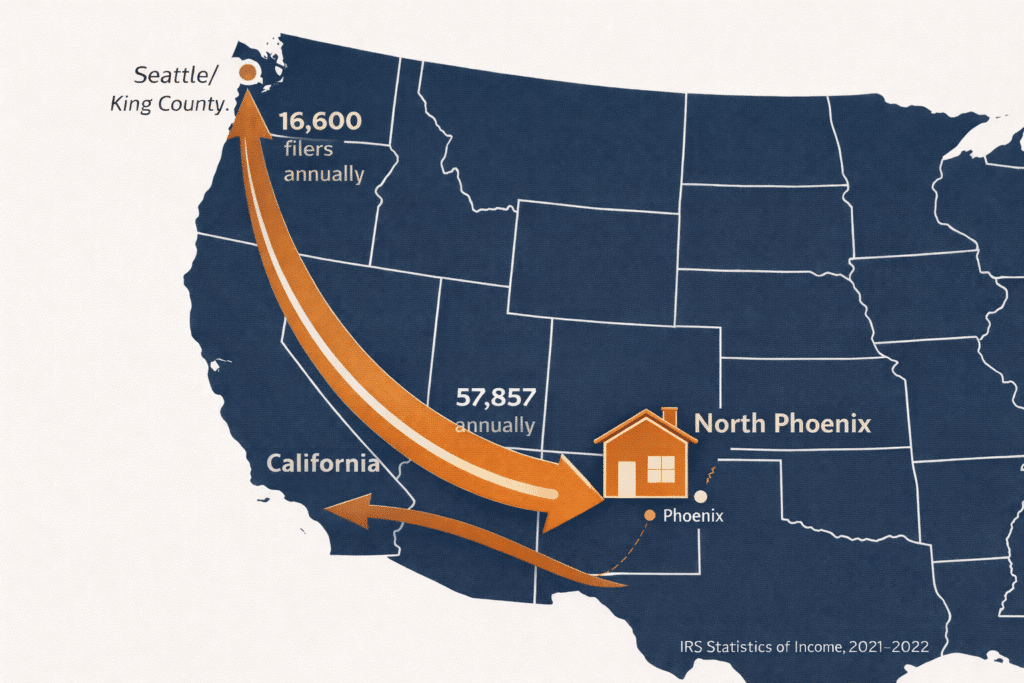
Washington state residents relocated to Arizona in the 2021–2022 IRS filing year — the second-largest state-to-state migration corridor into Arizona that year.
Source: IRS Statistics of Income, State-to-State Migration Data, 2021–2022