Gilbert is the most searched Phoenix Valley destination among Inland Empire homeowners running relocation equity math — and the numbers explain why. At approximately $287 per square foot, Gilbert delivers significantly more physical living space per dollar than either Riverside County (~$367/sqft) or San Bernardino County (~$334/sqft). Combined with Arizona’s 2.5% flat income tax and Maricopa County’s ~0.52%–0.64% effective property tax rate, Gilbert converts Inland Empire equity into measurably lower annual costs from year one.
Not every Inland Empire homeowner arrives at Gilbert with the same financial equation. The math differs meaningfully based on origin county.
NOTE ON BOTH CARDS: All calculations are estimates for planning purposes. Purchase price, mortgage rate, down payment, and local tax jurisdiction vary by property and timing. Consult a licensed real estate professional and a qualified tax professional for situation-specific figures. Sources: CAR Nov 2025; ARMLS / FlexMLS Oct–Nov 2025; Maricopa County Treasurer FY2024; Tax Foundation 2025.

Gilbert is a move-up purchase for most SB County buyers. The financial case is not “spend less” — it is “spend ~$95K less than SB County for identical square footage, and save ~$3,100+ annually on property tax alone, plus the income tax delta.”
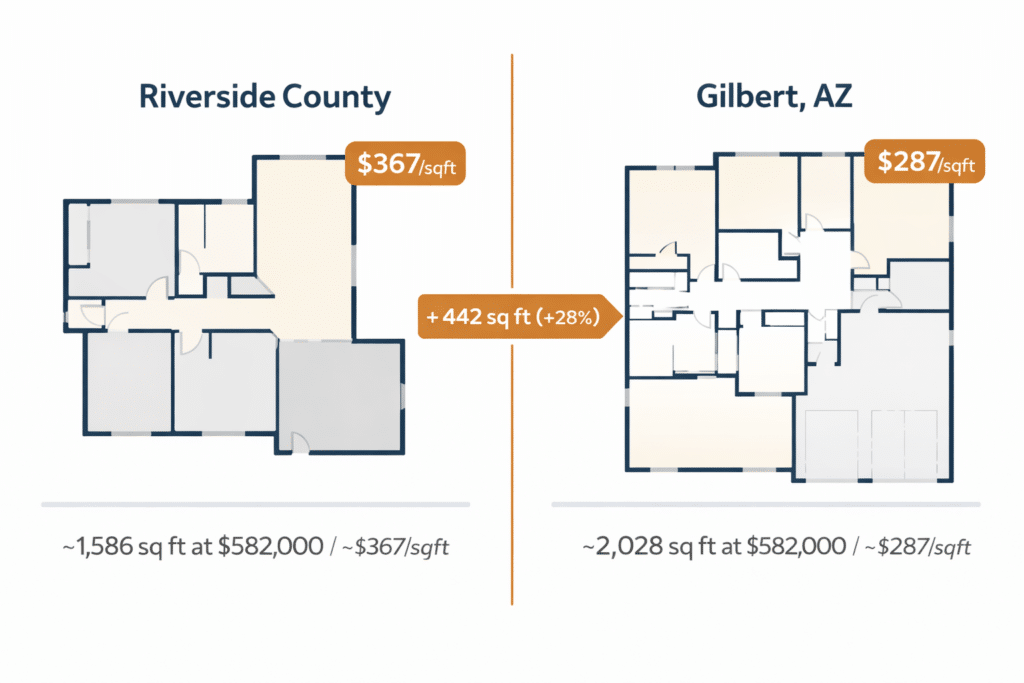
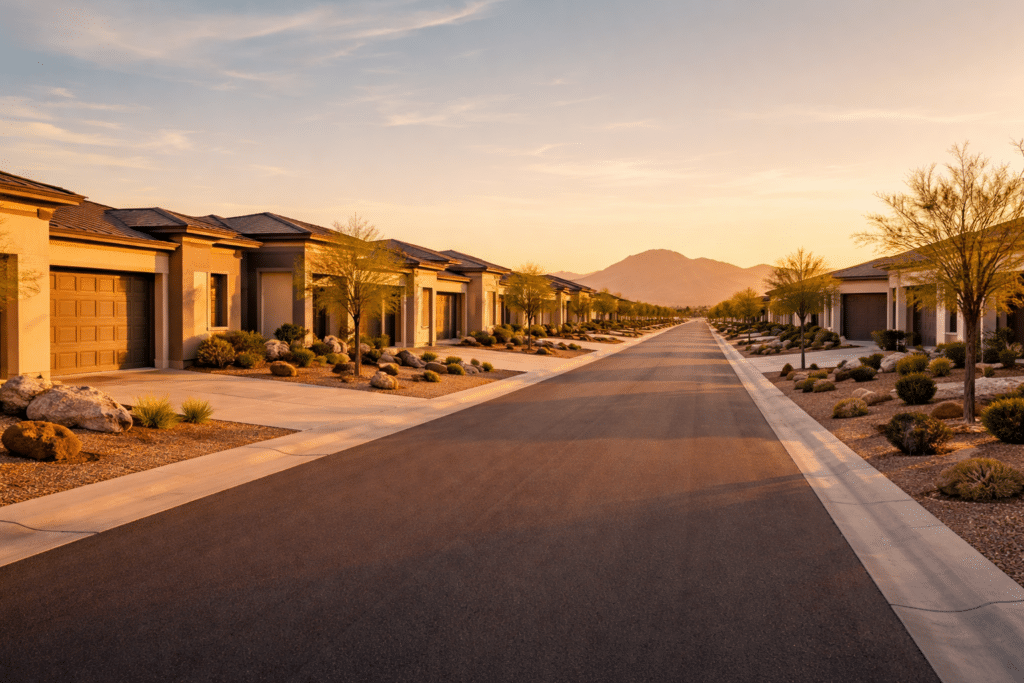
Price-per-square-foot is the metric that most accurately captures what a dollar of housing budget actually purchases in physical living space. Gilbert’s advantage here is structural, not temporary — it reflects the cost differential between a land-constrained Southern California market and a master-planned east Valley community with historically lower land acquisition costs per acre.
As of October 2025, Gilbert’s average sold price per square foot was approximately $287, based on ARMLS data via FlexMLS. This compares to approximately $367 per square foot in Riverside County and approximately $334 per square foot in San Bernardino County — both from California Association of Realtors and regional MLS data for late 2025.
| Market | Price / Sq. Ft. | At $582,000 Budget |
|---|---|---|
| Riverside County, CA | ~$367/sqft | ~1,586 sq ft |
| San Bernardino County, CA | ~$334/sqft | ~1,743 sq ft |
| Gilbert, AZ | ~$287/sqft | ~2,028 sq ft |
| Gilbert vs. Riverside | +$80/sqft more in CA | +442 sq ft in AZ (+28%) |
| Gilbert vs. SB County | +$47/sqft more in CA | +285 sq ft in AZ (+16%) |
Sources: ARMLS / FlexMLS, Oct 2025 (Gilbert); CAR / MLS data, late 2025 (Riverside County, San Bernardino County).
In practical terms, a Riverside County homeowner who sells a 1,800 square foot home and relocates to Gilbert with a $582,000 purchase budget is exchanging a 1,586 square foot California purchase for a 2,028 square foot Gilbert home — gaining a bedroom, a home office, or a formal dining room at the same price point. The garage situation compounds the difference: three-car garages are standard in Gilbert’s new-construction and move-up inventory at the $500,000–$700,000 price range. They are an exception, not a baseline, at comparable price points in the Inland Empire.
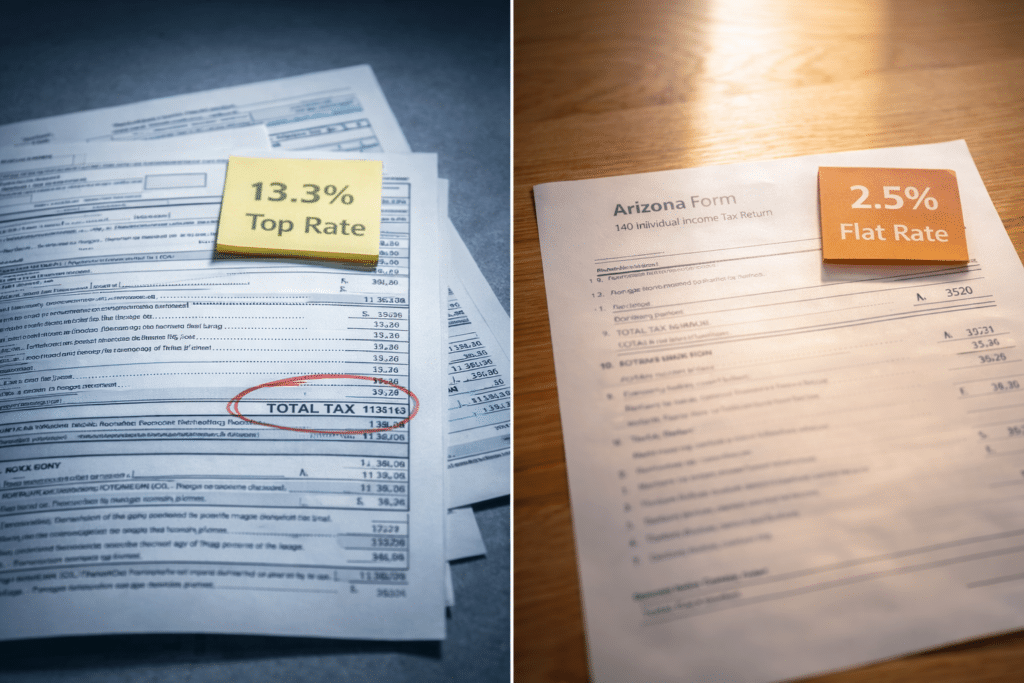
The income tax differential between California and Arizona does not change based on which Phoenix Valley community a buyer chooses — it is a function of state residency, not municipality. But it is worth restating in the context of a Gilbert destination page because it is the largest single annual cost advantage for most IE buyers who relocate, and it accrues from day one of Arizona residency.
California’s graduated income tax reaches 13.3% at the top marginal rate — the highest in the country (Tax Foundation, 2025). Arizona’s flat 2.5% rate applies to all taxable income regardless of amount. For a Gilbert household earning the Gilbert median of approximately $122,445 (Census ACS 2023), the estimated annual state income tax savings from California to Arizona:
Note: CA estimate based on 2025 Tax Foundation brackets, approximate standard deduction for married filing jointly. AZ estimate at 2.5% flat on approximate taxable income. For planning purposes only — individual tax situations vary. Consult a qualified tax professional. Sources: Tax Foundation, State Income Tax Rates, 2025; Census ACS 2023.
At $7,000–$9,000 in annual income tax savings, a Gilbert household retains approximately $70,000–$90,000 in additional capital over ten years — relative to continuing to pay California’s rate. That is capital available for mortgage paydown, retirement contributions, or liquid reserves.
Source: Tax Foundation, 2025
Tax Foundation, 2025
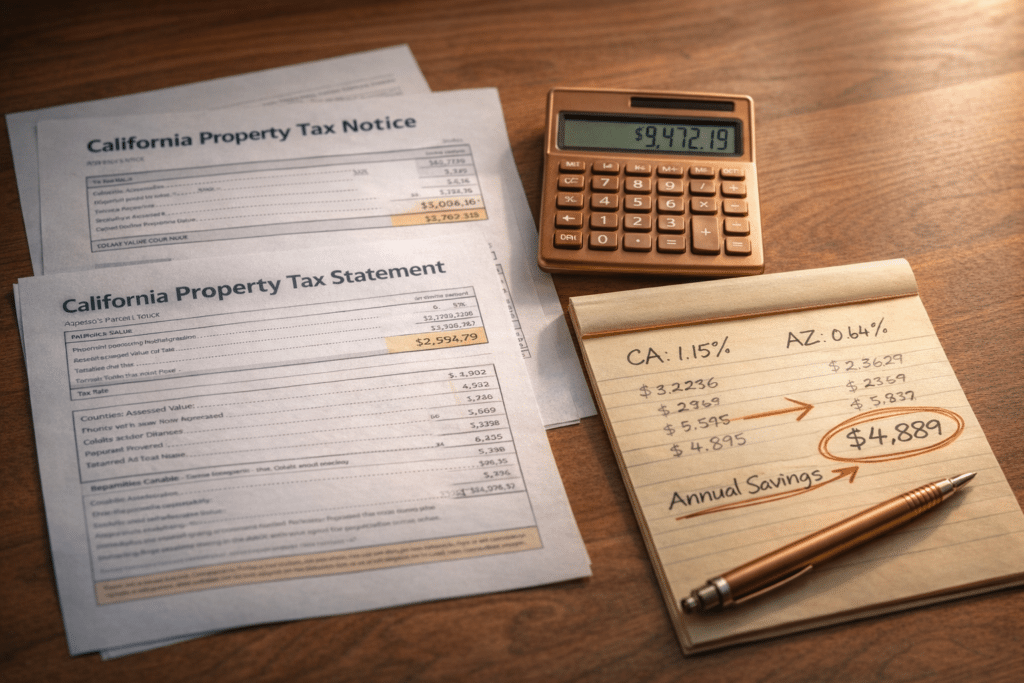
Property taxes in Arizona are governed at the county level. Gilbert is located entirely within Maricopa County, which carries one of the lower effective residential property tax rates in the metropolitan west — approximately 0.52%–0.64% effective rate as measured by the Maricopa County Treasurer (FY2024 Popular Annual Financial Report) and validated by third-party effective rate analysis (Ownwell, citing Maricopa County Treasurer data).
The Arizona residential property tax system works differently from California’s Proposition 13 framework. In Arizona, assessed value for residential property is set at 10% of the property’s full cash value (market value), which is then multiplied by the applicable tax rate — which includes county, town/city, school district, and any applicable special district levies. There is no “reset” from a protected base, but rates are substantially lower than IE effective rates on new purchases.
For Inland Empire buyers, the Proposition 13 protection they currently enjoy disappears the moment they sell — whether they rebuy in California or move to Arizona. The comparison that matters is: IE new-purchase effective rate vs. Arizona effective rate.
| Market | Eff. Rate on New Purchase |
Annual Bill (Est.) |
Monthly Cost (Est.) |
|---|---|---|---|
| Riverside Co., CA | ~1.10–1.20% | ~$6,402–$6,984 | ~$534–$582 |
| San Bernardino Co., CA | ~1.15–1.20% | ~$6,693–$6,984 | ~$558–$582 |
| Gilbert, AZ (Maricopa) | ~0.52–0.64% | ~$3,026–$3,725 | ~$252–$310 |
| Annual savings vs. IE | ~$2,677–$3,958 | ~$222–$330/mo |
Sources: Maricopa County Treasurer, FY2024 PAFR; Ownwell effective rate analysis (Maricopa County data); Tax Foundation; Victor Valley Times / BlockShopper Q4 2024 (IE effective rate reference). All figures are estimates. Actual bills depend on special district levies, exemptions, and final assessed value.
Over a ten-year ownership period at the midpoint of these estimates, a Gilbert homeowner saves approximately $30,000–$40,000 in cumulative property taxes relative to a comparable new-purchase IE homeowner — with no change in home value required.
Source: ARMLS / FlexMLS, Oct–Nov 2025
Source: ARMLS / FlexMLS, Oct 2025
Source: ARMLS / FlexMLS, Oct–Nov 2025
Source: Maricopa County Treasurer, FY2024
Source: AZ Dept. of Revenue; Town of Gilbert, 2025
Source: U.S. Census Bureau, 2024 PEP
Gilbert’s sales tax rate of 8.3% reflects the Town of Gilbert’s January 2025 increase from 1.5% to 2.0% city-level tax, layered on top of Arizona’s state rate of 5.6% and Maricopa County’s 0.7% — a total of 8.3% combined (Town of Gilbert Council Action, October 2024; Arizona Department of Revenue, 2025). Gilbert’s combined rate is modestly below Phoenix proper’s 8.6%.
Note: Days on market have increased from 58–60 days in 2024 to 70–73 days in late 2025, reflecting a market that has moved meaningfully toward buyers relative to prior years. Inventory has increased compared to 2024 across the east Valley, giving relocating Inland Empire buyers more negotiating room than they would have encountered in 2022 or 2023.
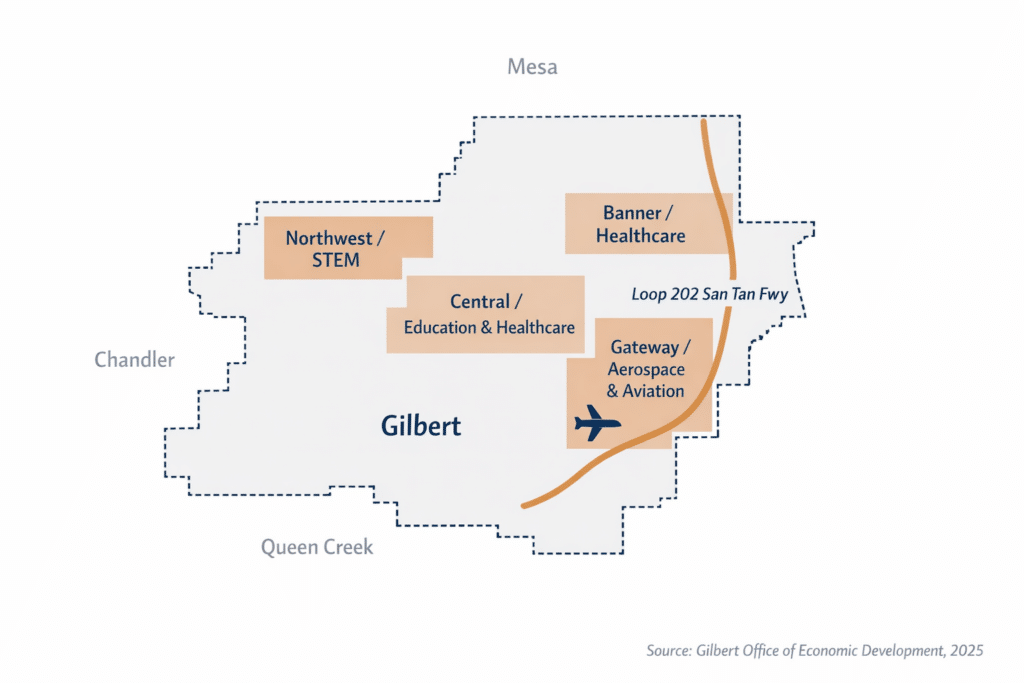
For IE buyers whose household income is earned employment income — not retirement or investment distributions — proximity to employment corridors is a financial variable in the relocation equation. Gilbert’s employment geography is anchored by four corridors (Gilbert Office of Economic Development, 2025):
1. GATEWAY EMPLOYMENT AREA: Located along Gilbert’s eastern municipal border, adjacent to Phoenix-Mesa Gateway Airport. Aerospace and aviation firms, large retail and distribution operations. Served by the Loop 202 San Tan Freeway. Approximately 1,000 acres of undeveloped commercial land as of 2025 — one of the largest remaining employment land banks in the east Valley (Gilbert EDI, 2025).
2. CENTRAL EMPLOYMENT AREA: Off the 202 Freeway, proximate to Phoenix-Mesa Gateway Airport, Arizona State University Polytechnic Campus, and Chandler-Gilbert Community College. Mixed commercial and education-adjacent uses.
3. NORTHWEST EMPLOYMENT CORRIDOR: Science, technology, engineering, and mathematics (STEM) occupations cluster; links to the broader Chandler technology corridor and the East Valley semiconductor / technology belt.
4. BANNER HEALTH CORRIDOR: Near Gilbert’s northeast boundary at the US 60 Superstition Freeway. Healthcare research, services, and treatment facilities — one of the Valley’s fastest-growing medical employment nodes.
Loop 202 access. Adjacent to Phoenix-Mesa Gateway Airport. ~1,000 acres of undeveloped commercial land. Aerospace and aviation anchors.
Off Loop 202. ASU Polytechnic Campus proximity. Mixed commercial and higher education adjacency.
Technology and engineering occupations. Connects to Chandler semiconductor / innovation corridor.
Northeast Gilbert at US 60. Healthcare R&D, treatment, and services employment node.
The Loop 202 San Tan Freeway is Gilbert’s primary freeway spine, connecting to the Loop 101 Price Freeway to the west, Interstate 10 to the south, and the US 60 Superstition Freeway to the north. Travel time to Chandler’s semiconductor corridor, Tempe’s technology office parks, and central Phoenix typically runs 25–40 minutes depending on origin point within Gilbert.
For IE buyers who maintain employment in Arizona — or who work remotely — Gilbert’s employment infrastructure provides both resident-income stability and long-term property value support, as employment growth drives continued housing demand in the east Valley.
Gilbert is approaching full build-out. The Town of Gilbert’s Office of Economic Development projects the community will reach full residential development by approximately 2030, with a projected population ceiling of over 330,000 residents (Gilbert EDI Demographics, 2025). As of 2024, the Census Bureau estimated Gilbert’s population at approximately 289,000 — meaning roughly 90% of the community’s eventual residential footprint is already in place.
For buyers, this creates two competing dynamics that are both financially relevant:
CONSTRAINT: New construction land is increasingly scarce. Communities currently delivering homes in Gilbert — including Waterston (starting approximately $700,000 for homes from 2,450 to 3,850 square feet), Granview at Somerset, and smaller infill pockets — represent what remains of the new construction pipeline. Buyers who want new construction in Gilbert have fewer options at each successive year.
SUPPORT: Approaching build-out provides long-term price floor support. Communities that have reached or are near full build-out typically experience lower downside price volatility than growth-stage markets because supply expansion is constrained. For IE buyers treating their Gilbert home as a long-term asset, this is a material consideration.
The resale market in Gilbert at $450,000–$650,000 remains active and provides the primary entry point for IE buyers who cannot access the shrinking new construction inventory. The ARMLS market data for October–November 2025 reflects a balanced-to-buyer-favorable environment at current interest rates, with days on market of 70–73 days providing time for deliberate offer decisions.
Source: Gilbert EDI, 2025
Source: Gilbert EDI, 2025
Running all cost categories simultaneously for a representative Riverside County homeowner purchasing at Gilbert’s median:
| Category | Est. Annual Savings in Gilbert |
|---|---|
|
Monthly P&I differential
(Riverside $635K vs. Gilbert $582K, 20% down, 6.5% 30-yr fixed)
|
~$3,228/year (~$269/month) |
|
State Income Tax
(CA vs. AZ on ~$122,445 annual income)
|
~$7,347–$9,184/year |
|
Property Tax
(IE 1.15% vs. AZ 0.64% on $582,000 purchase)
|
~$2,677–$3,958/year |
|
Price-per-sqft arbitrage
(not a dollar savings — a space dividend)
|
+442 sq ft of living space at same purchase price |
| Sales Tax | Broadly comparable (8.75% SB City vs. 8.3% Gilbert) |
| COMBINED ESTIMATED ANNUAL SAVINGS (P&I + Income Tax + Property Tax) |
~$13,252–$16,370/year |
Over ten years, at the low end of these estimates, a Riverside County household that purchases in Gilbert retains approximately $132,000 more in capital than continuing as a California homeowner — not counting Arizona equity appreciation on the purchased asset.
For San Bernardino County buyers, the combined picture is different in structure but similar in total: the purchase price premium they pay for Gilbert (~$67K more than the SB County median) is offset in approximately 22 months of combined property tax and income tax savings. After that payback period, every month produces net positive savings vs. continuing to own in SB County.