Riverside and San Bernardino County homeowners are sitting on equity that stretches significantly further in the Phoenix Valley. This guide shows you the exact math — what your IE home is worth, what it buys you in Arizona, and how much you save on taxes the day you close.
Most Inland Empire homeowners don’t fully account for the financial position they’ve built. Riverside County’s median home price sat at approximately $599,000 in late 2025, while San Bernardino County’s median was approximately $521,000 — still a meaningful step below the coastal California markets to the west, but substantial compared to Phoenix Valley pricing.
If you purchased your home before 2020, you are almost certainly sitting on six figures of equity. The Inland Empire saw home price appreciation of 44% in Riverside County and 46% in San Bernardino County between 2019 and 2022 alone (CAR, Southern California News Group, December 2025). That equity doesn’t depreciate when you move — it travels with you, and in Arizona, it goes to work on a market where the median sale price in Maricopa County registered approximately $485,000 through mid-2025 (ARMLS, 2025).
That delta is your relocation dividend.
Riverside County Median (2025)
Source: CAR / Southern California News Group, Dec. 2025
Maricopa County Median (2025)
Source: ARMLS, 2025
Price Gap (Riverside → Maricopa)
Note: Buy more — for less.

Source: IRS SOI / U.S. Census Bureau
The financial case for relocating from the Inland Empire to Arizona isn’t only about purchase price. It’s about what each dollar buys in physical space.
In Riverside County, the median price per square foot ran approximately $371 in late 2025 (CAR / Southern California News Group). In Maricopa County, the ARMLS-reported figure for the same period was approximately $265 per square foot — a 28% discount per square foot before you factor in the price gap.
Run that math on a $560,000 budget — roughly the midpoint between Riverside and San Bernardino medians — and the result is striking:
| Market | $560,000 Budget | Approx. Sq. Footage |
|---|---|---|
| Riverside County | $560,000 | ~1,510 sq. ft. |
| Maricopa County | $560,000 | ~2,113 sq. ft. |
| Difference | +603 sq. ft. (+40%) |
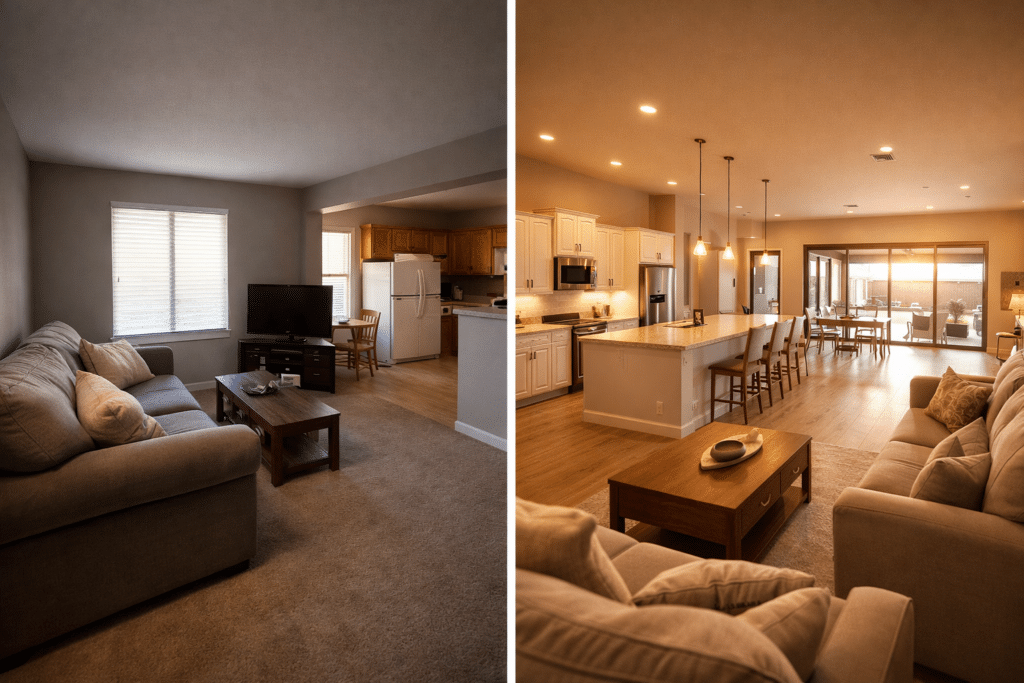
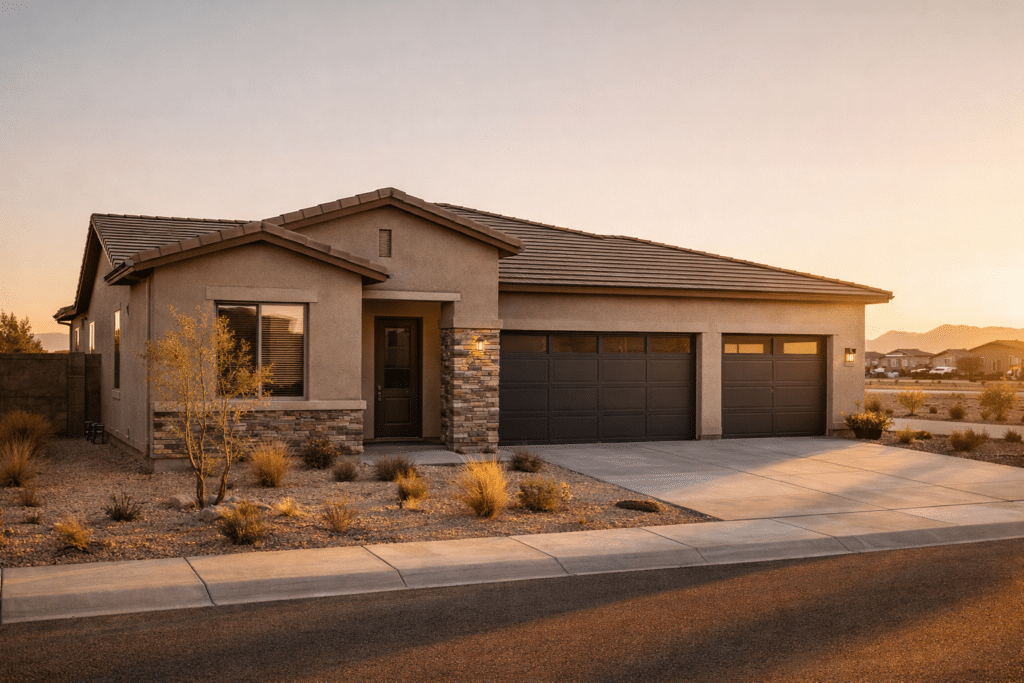
That 40% space premium isn’t hypothetical — it’s the difference between a three-bedroom home with a shared garage and a four-bedroom home with a three-car garage, a covered patio, and room for a pool.
The equity gap is the headline, but the annual tax delta is the compounding advantage that makes relocation from the Inland Empire to Arizona a long-term financial restructuring — not just a one-time transaction.
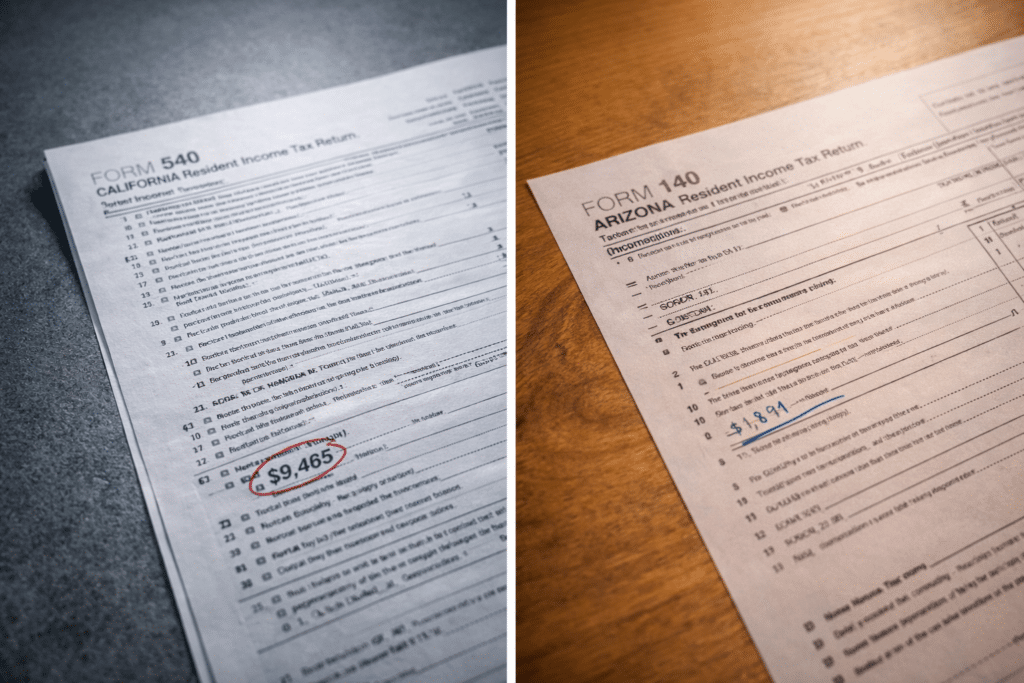
California’s top marginal income tax rate reaches 13.3%, the highest of any state in the nation (Tax Foundation, 2025). Arizona, by contrast, implemented a flat income tax of 2.5% effective 2023 — the lowest flat rate of any state with an income tax (Tax Foundation, 2025). For a household earning $150,000 in annual income, the difference in state income tax liability between California and Arizona can exceed $8,000 per year, depending on deductions and filing status. Over a ten-year horizon, that delta represents $80,000 or more in retained capital — capital that stays in your pocket rather than Sacramento’s.
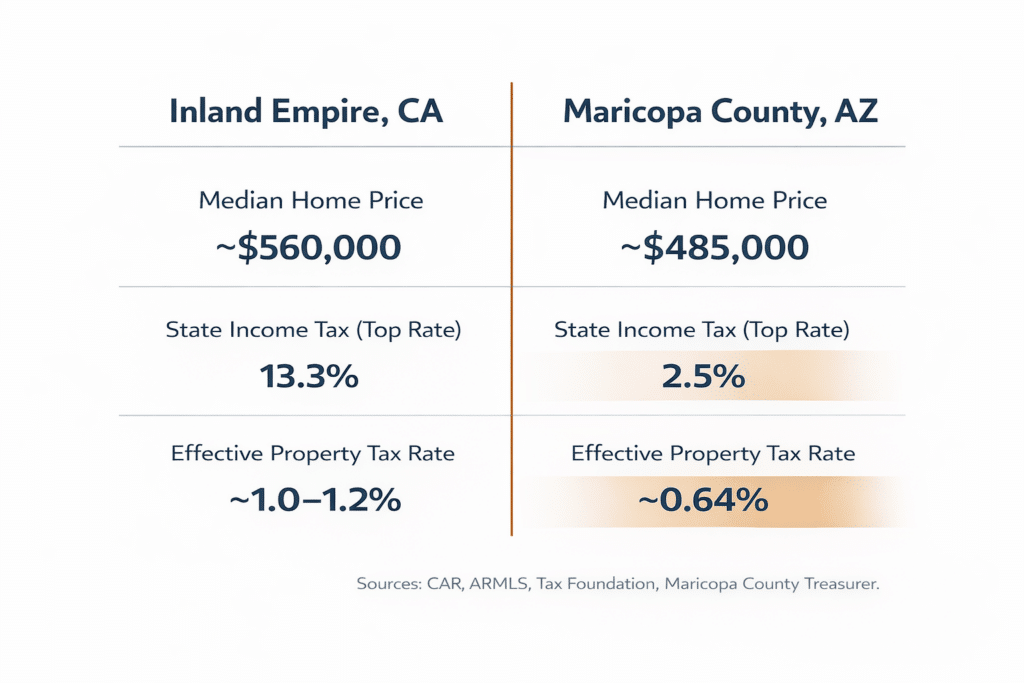
California’s Proposition 13 caps property tax increases for existing owners, but that protection disappears the moment you sell and buy again at current market prices. Under Prop 13, a new purchase is reassessed at full market value, then taxed at approximately 1% of purchase price plus local special assessments. On a $560,000 IE purchase, that’s approximately $5,600 or more annually.
In Arizona, the effective property tax rate on owner-occupied residential property in Maricopa County was approximately 0.64% of market value (Maricopa County Treasurer, FY2024 data). On a $485,000 Arizona purchase, that’s approximately $3,104 annually — a savings of roughly $2,500 or more per year compared to a comparable-priced California purchase.
California Top Income Tax Rate
Source: Tax Foundation, 2025
Arizona Flat Income Tax Rate
Source: Tax Foundation, 2025
Effective Property Tax Rate — Maricopa County
Source: Maricopa County Treasurer, FY2024
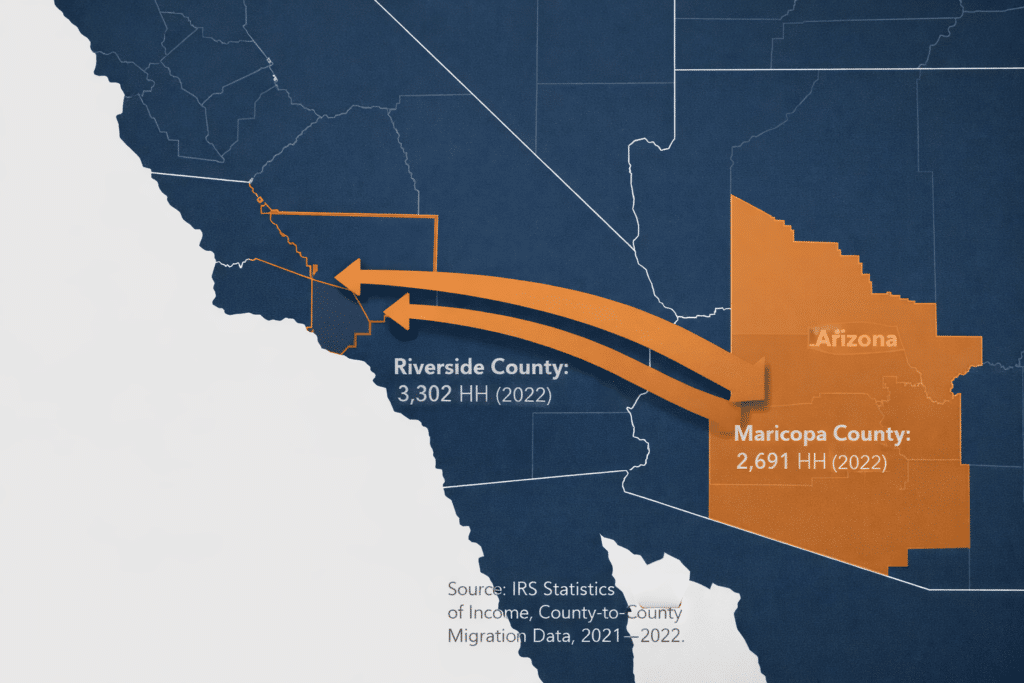
Inland Empire homeowners aren’t acting on a hunch — they are acting on mathematics that tens of thousands of households before them have already validated. According to IRS Statistics of Income county-to-county migration data, approximately 3,302 households relocated from Riverside County to Maricopa County in 2022, and an additional 2,649 households made the same move from San Bernardino County — a combined total of nearly 6,000 IE households choosing the Phoenix Valley in a single filing year. That represents some of the strongest IE-to-Arizona migration volume in the IRS dataset (IRS SOI, 2021–2022 county migration data; U.S. Census Bureau).
The pattern is structural, not cyclical. IRS data across multiple filing years confirm a persistent net outflow from both Riverside and San Bernardino Counties to Maricopa County. These are households with income — the IRS data by definition only captures filers — and they are choosing Arizona at scale.
Riverside County → Maricopa (2022)
Source: IRS SOI / Census Bureau
San Bernardino County → Maricopa (2022)
Source: IRS SOI / Census Bureau
Combined IE → Maricopa (2022)
Source: IRS SOI / Census Bureau
The financial math varies by starting point. Your Riverside home carries a different equity position than a home in Rancho Cucamonga or San Bernardino — and the comparison to a specific Phoenix Valley destination shifts accordingly. Select your origin city for a city-specific breakdown.
Riverside County-specific equity analysis, price comparisons, and Phoenix Valley destination guides.
San Bernardino County equity position, tax delta, and where your equity lands in the Phoenix Valley.
Your equity doesn’t translate into a generic “Arizona home.” It translates into a specific number of square feet, a specific community, and a specific monthly payment — all of which depend on where in the Valley you land. Explore the destination guides most relevant to the IE-to-Arizona profile.
Our brokerage partner, West USA Realty, represents buyers relocating to Gilbert, Chandler, Scottsdale, and all Phoenix Valley communities. Connect directly with a licensed Arizona agent at westusa.net.

Gilbert’s master-planned communities offer IE buyers 2,000–3,000 sq. ft. at price points substantially below Riverside County medians.
Mesa’s east Valley location and strong new-construction inventory make it one of the highest-value landing points for IE equity.
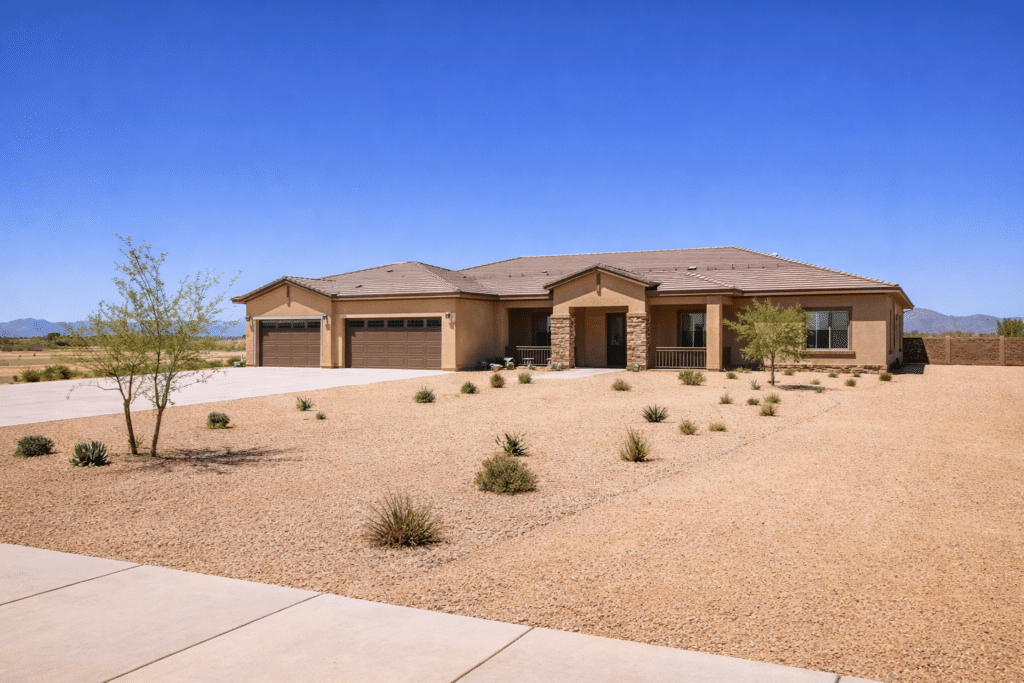
Surprise and Goodyear offer IE buyers the largest lot sizes per dollar anywhere in the Maricopa market.