Oregon’s income tax stack alone can cost Portland-area households $10,000 or more per year compared to Arizona’s 2.5% flat rate. Add the housing cost differential and broad consumer price gap, and the total financial arbitrage becomes one of the most compelling relocation cases on the West Coast.
Most cost-of-living comparisons stop at grocery prices and gas. That approach understates the actual financial gap between Portland and Phoenix by a wide margin.
For Portland homeowners considering relocation, the more accurate calculation combines five separate line items: housing costs, state and local income taxes, property taxes, consumer price differentials, and the sales tax offset. Each category moves in a different direction and by a different magnitude. Run them all together, and the net annualized financial benefit of relocating from Portland to the Phoenix Valley typically ranges from $15,000 to $25,000 or more per year for a mid-income household—before any equity gain from the transaction itself.
This page breaks down each category using current data from approved sources. The goal is not to make the case for you. It is to give you the numbers you need to make the case yourself.
Portland’s cost of living premium over Phoenix
SOURCE: BLS Consumer Expenditure Survey benchmarks, 2024
Oregon state + Portland local combined top income tax rate
SOURCE: Tax Foundation, 2025 State Tax Competitiveness Index
Arizona’s flat state income tax rate
SOURCE: Tax Foundation, 2025

Source: BLS Consumer Expenditure Survey benchmarks, 2024
The Portland metro median sale price landed at approximately $537,000 in early 2025, based on Regional Multiple Listing Service (RMLS) data. The Phoenix city proper median for 2024 full-year came in at approximately $480,000, based on ARMLS transaction records. On face value, that is a $57,000 price differential in Arizona’s favor—meaningful, but not as dramatic as the California-to-Phoenix gap that anchors other pages on this site.
The more relevant comparison, however, is what that dollar figure buys in physical space. At the $537,000 price point in the Portland metro, buyers are typically looking at homes built before 2000, often with 1,600 to 2,100 square feet on a smaller urban or near-urban lot. At the same price point in Phoenix Valley suburban communities—Gilbert, Chandler, Mesa—buyers routinely access 2,400 to 3,200 square feet of newer construction, larger lots, and HOA amenity packages (pool, parks, trails) that do not exist in comparable Portland price ranges.
The home price arbitrage is real. But it is only the beginning of the financial calculation.
| Metric | Portland Metro | Phoenix Valley |
|---|---|---|
| Median Sale Price (2024/2025) | ~$537,000 | ~$480,000 |
| Typical Sq Ft at Median Price | 1,600–2,100 sq ft | 2,400–3,200 sq ft |
| Median Price per Sq Ft | ~$255–$335/sq ft | ~$175–$220/sq ft |
| Effective Property Tax Rate | ~0.78% | ~0.52% |
| Annual Property Tax at Median | ~$4,189 | ~$2,496 |
| Annual Property Tax Savings (AZ) | — | ~$1,693/year |
Sources: RMLS (Portland metro, Q4 2024/Q1 2025); ARMLS (Phoenix, 2024 annual); Maricopa County Treasurer (effective rate); Tax Foundation / Kiplinger Oregon Tax Guide (Oregon effective rate, 2024).
Note: Property tax effective rates are expressed as a percentage of market value. Portland Metro figure reflects Oregon statewide average. Phoenix Valley figure reflects Maricopa County. Individual property assessments may vary.
Oregon has no statewide sales tax—a meaningful financial advantage for daily consumer spending. But that single advantage does not neutralize the state’s income tax burden, particularly for Portland-area residents who face multiple overlapping income tax layers.
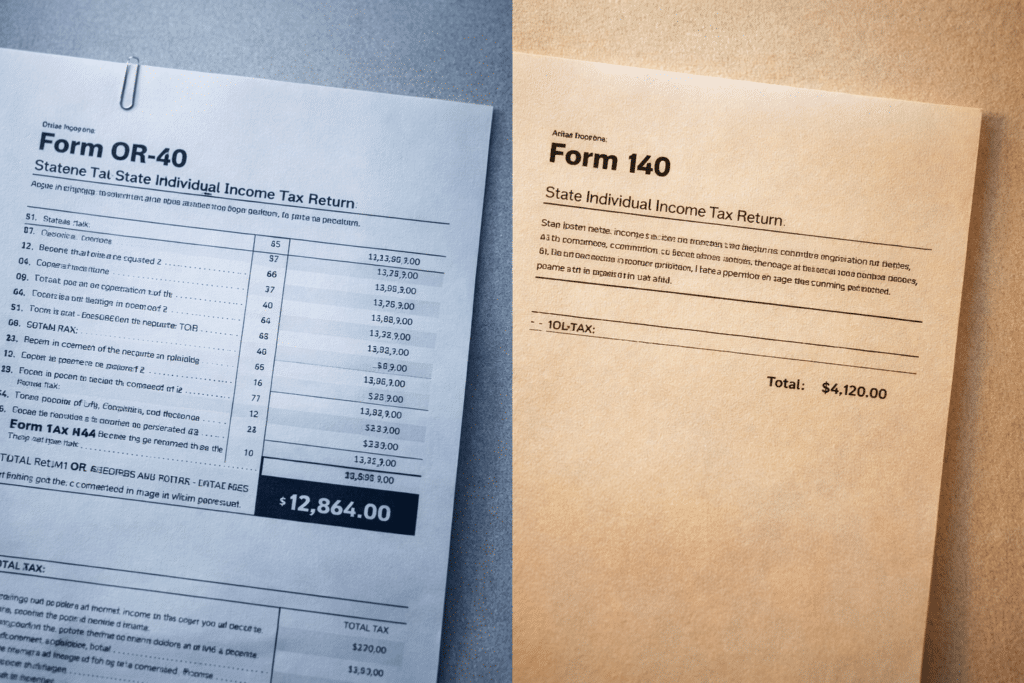
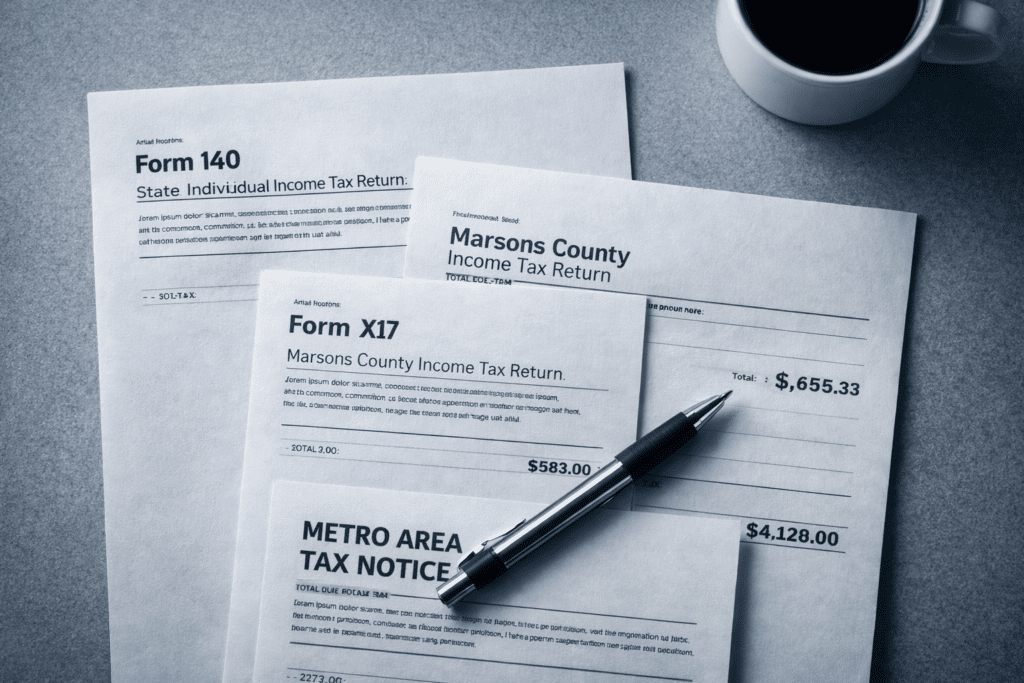
As of 2025, Portland-area homeowners with earned income face three distinct income tax charges on the same dollar of wages: Oregon state income tax, a Multnomah County personal income tax, and the Metro Supportive Housing Services income tax. At upper-middle income levels, these three taxes combined can reach a top marginal rate of 13.9 percent—the highest combined local income tax burden in the nation, according to the Tax Foundation’s 2026 State Tax Competitiveness Index.
In Arizona, there is one income tax: a flat 2.5 percent on all taxable income, regardless of bracket. No county surcharges. No metro-level income taxes.
Four graduated brackets. Top 9.9% rate applies to single filers above $125,000 and joint filers above $250,000. Brackets are not fully indexed for inflation, per Tax Foundation (2025). Oregon also imposes an estate tax with a $1 million exemption threshold—the lowest estate tax exemption among all states that levy the tax.
Applies to Portland-area residents earning above $125,000 (single) or $200,000 (joint). Graduated structure. Enacted in 2021 as the Preschool for All program. This is a county-level charge on top of Oregon state income tax.
Applies to Portland Metro area residents with income above $125,000 (single) or $200,000 (joint). Enacted in 2020. Combined with the Multnomah County tax, Portland-area residents above those thresholds face up to 4% in local income taxes before the Oregon state rate is applied.
| Tax Component | Portland (OR) | Phoenix (AZ) |
|---|---|---|
| State Income Tax (approx. effective) | ~$11,200 | $3,750 |
| County / Local Income Tax | ~$1,500–$2,200 | $0 |
| Metro SHS Income Tax (if applicable) | ~$0–$250* | $0 |
| Combined Income Tax Estimate | ~$12,700–$13,650 | $3,750 |
| ANNUAL INCOME TAX SAVINGS (ARIZONA) | — | ~$8,950–$9,900 |
Metro SHS tax threshold for joint filers is $200,000; not applicable at $150,000 AGI. Applied at income above $200,000 joint.
IMPORTANT NOTE: These are illustrative estimates only, based on publicly available tax rate schedules (Tax Foundation, 2025; Oregon Department of Revenue). Actual tax liability depends on deductions, credits, filing status, and sources of income. Consult a qualified tax professional before making relocation decisions based on tax projections.
Sources: Tax Foundation, 2025 State Tax Competitiveness Index; Tax Foundation, 2026 State Tax Competitiveness Index (Oregon); Oregon Department of Revenue.
Oregon is one of five states with no state or local sales tax. For daily consumer spending—groceries, clothing, electronics, home goods—this is a genuine financial advantage. Arizona’s combined average sales tax rate runs approximately 8.37 percent, factoring in the 5.6 percent state base rate plus local additions (Tax Foundation, 2024).
The honest math: a household spending $35,000 per year on taxable goods and services in Arizona will pay approximately $2,900 in sales tax annually that they would not pay in Oregon.
That $2,900 annual sales tax cost partially offsets Arizona’s income tax advantage. At a $150,000 household income, the income tax savings are roughly $9,000–$10,000 per year; the sales tax offset is approximately $2,900. Net advantage to Arizona: still $6,000–$7,000 per year in combined income and sales tax differential, before accounting for property tax or housing cost differences.
Run this math at higher income levels—$200,000, $250,000—and the net advantage widens further, because the income tax savings scale with income while the sales tax offset is capped by what you actually spend.

~$6,000–$7,000/year (After income tax savings minus estimated sales tax cost)
Source: Tax Foundation (2024–2025); calculations based on published rate schedules. Consult a tax professional for personalized analysis.
Income tax and housing capture the largest gaps. But the broader cost-of-living differential between Portland and Phoenix extends across every major consumer spending category measured by the Bureau of Labor Statistics’ Consumer Expenditure Survey and the Consumer Price Index.
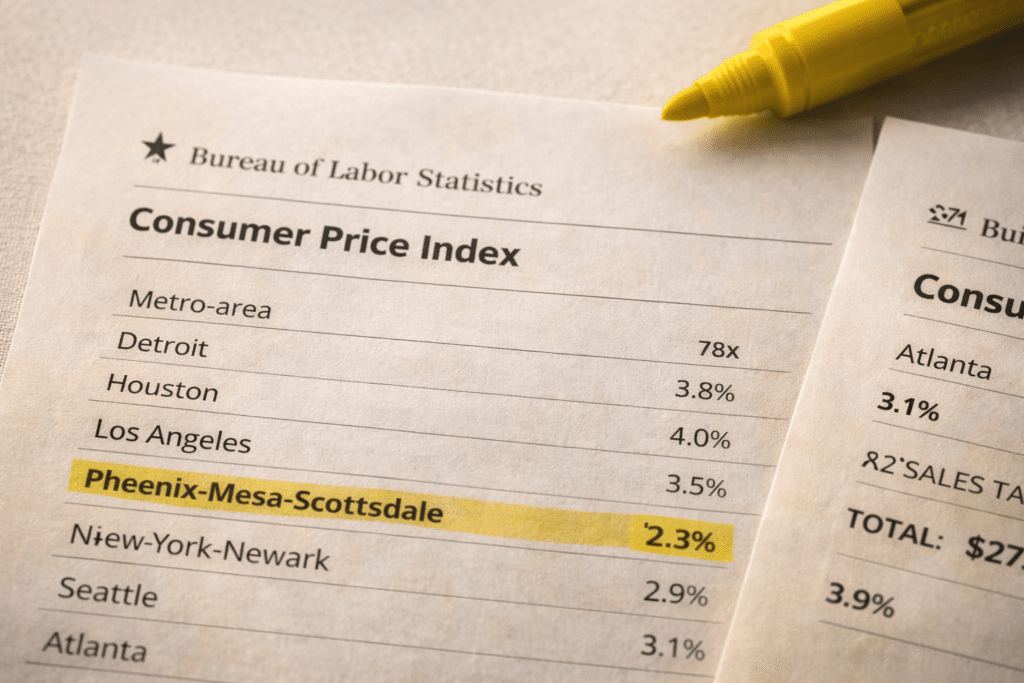
BLS publishes metro-level CPI data for the Phoenix-Mesa-Scottsdale metropolitan area. Over the 12 months ending August 2024, the Phoenix metro CPI rose 2.3 percent—among the more moderate readings of any major Western metro during that period (BLS, Phoenix Area CPI, August 2024). Broader West Region CPI trends, which include Oregon and Washington, tracked higher during the same period.
Portland’s overall cost structure—across housing, transportation, utilities, and services—runs materially above Phoenix by multiple independent cost-of-living benchmarking datasets. The Council for Community and Economic Research’s 2024 Cost of Living Index placed Phoenix at approximately 6.3 percent above the national average, while Portland consistently indexes significantly higher across the same measures.
| Cost Category | Portland Relative to National Avg | Phoenix Relative to National Avg |
|---|---|---|
| Overall Cost of Living | ~115–120 | ~106 |
| Housing Costs | ~130–140 | ~108–112 |
| Grocery / Food at Home | ~104–108 | ~103–105 |
| Transportation | ~112–118 | ~107–110 |
| Healthcare | ~108–115 | ~100–105 |
| Utilities | ~95–100* | ~105–110 |
Oregon electric rates are among the lower in the Western region. This is one category where Oregon holds a cost advantage over Arizona.
IMPORTANT NOTE: Oregon’s utility costs—electricity in particular—tend to run below Arizona’s due to Oregon’s hydroelectric-heavy power mix. For households with high electric usage, this advantage is worth noting but typically does not offset the income tax and housing differentials in annual budget terms.
Sources: Council for Community and Economic Research (C2ER) Cost of Living Index, 2024; BLS Consumer Expenditure Survey, 2024; BLS Phoenix Area CPI, August 2024. Index values are approximate benchmarks; individual experience will vary.
A $13,000–$15,000 annual budget advantage does not arrive as a single check. It compounds in retained capital, in home equity paid down faster, in retirement accounts funded more fully, in discretionary cash flow that is not owed to the state. Over a decade, that differential represents $130,000–$150,000 in cumulative financial position—before any home price appreciation is considered.
For Portland homeowners with existing equity, the transaction itself often recapitulates several years of that annualized advantage in a single closing.
Mortgage assumptions: 30-year fixed at 6.75%; $537,000 Portland median vs. $480,000 Phoenix median; 20% down payment. PITI estimates include imputed insurance. Utility and transportation figures based on BLS Consumer Expenditure Survey averages adjusted for each metro. Tax estimates based on published rate schedules; actual liability will vary.

| Annual Budget Line Item | Portland (OR) | Phoenix Valley |
|---|---|---|
| Estimated Housing Cost (PITI, 20% down) | ~$3,400/mo | ~$2,950/mo |
| → Annual Housing Cost | ~$40,800 | ~$35,400 |
| State + Local Income Tax (estimated) | ~$12,700–$13,650 | ~$3,750 |
| Property Tax (at respective median) | ~$4,189 | ~$2,496 |
| Estimated Sales Tax (taxable purchases) | $0 | ~$2,900 |
| Utilities (electric, water, gas) | ~$2,400–$2,800 | ~$3,200–$3,600 |
| Transportation (avg. annual) | ~$11,500–$13,000 | ~$10,500–$12,000 |
| ESTIMATED TOTAL ANNUAL SPEND (MAJOR) | ~$72,000–$74,000 | ~$58,246–$60,146 |
| NET ANNUAL ADVANTAGE (ARIZONA) | — | ~$13,000–$15,000 |
Sources: RMLS (Portland metro, Q4 2024/Q1 2025); ARMLS (Phoenix, 2024 annual); Maricopa County Treasurer (effective rate); Tax Foundation / Kiplinger Oregon Tax Guide (Oregon effective rate, 2024).
The budget differential is a real number. But it is also a convertible one. Portland homeowners who relocate to the Phoenix Valley are not simply spending $13,000–$15,000 less each year in aggregate—they are often reallocating that capital into larger homes, faster mortgage paydown, or investment accounts.
At the $480,000–$550,000 price range in Phoenix Valley suburban communities, a Portland homeowner’s typical equity position enables the following outcomes that are generally not available in the Portland market at comparable price points:
• 2,400–3,200 square feet of living space versus Portland’s typical 1,600–2,100 at the same price point (Source: ARMLS 2024 transaction data; RMLS 2024 data)
• Newer construction: Phoenix Valley communities at this price tier include significant proportions of homes built after 2010, with modern mechanicals, energy-efficient insulation, and lower near-term maintenance cost profiles
• Lot sizes averaging 6,000–9,000 sq ft in East Valley master-planned communities versus Portland’s typical 4,000–6,000 sq ft urban and near-suburban lots at comparable price points
• HOA amenity infrastructure—community pools, parks, ramadas, walking trails —included in base carrying costs with no additional charge beyond HOA fees
• Effective property tax rate of approximately 0.52% (Maricopa County) versus Oregon’s approximate 0.78%—a delta that widens as home values increase
None of this is a lifestyle argument. It is a square-footage and cost-structure argument. More physical space at a lower carrying cost is a financial outcome, regardless of what you do with the space.

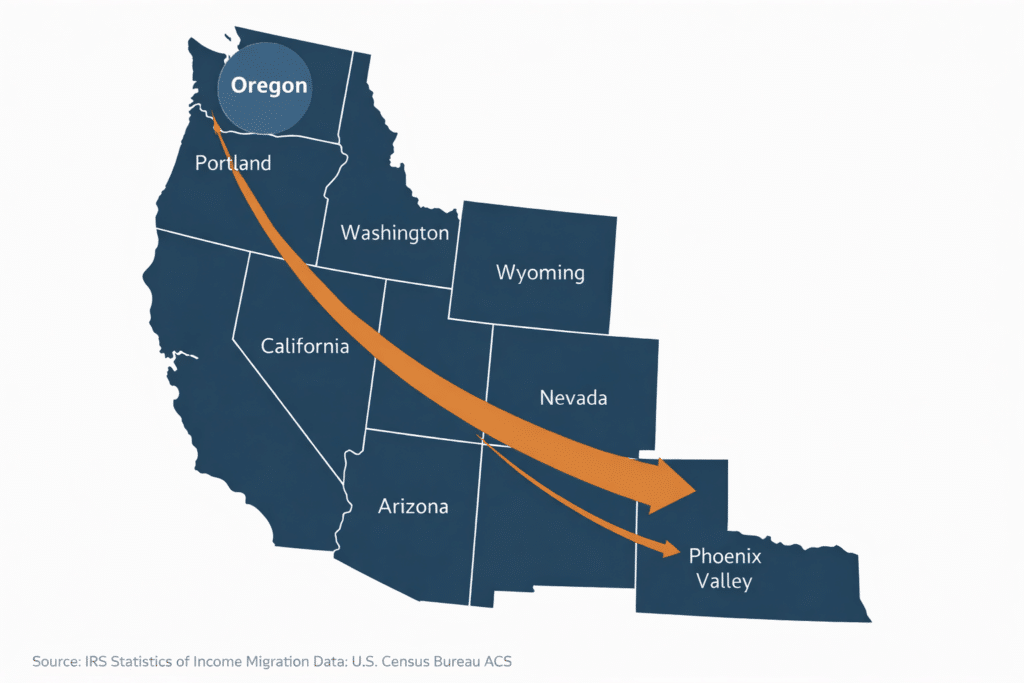
IRS Statistics of Income migration data and U.S. Census Bureau American Community Survey data both confirm net migration from Oregon to Arizona across a range of income brackets. The IRS tracks this movement by counting tax filer returns that change state-of-residence address year over year, along with the adjusted gross income those returns represent.
The relevant pattern for Portland homeowners: the $100,000–$200,000 AGI bracket and the $200,000+ AGI bracket both show consistent net outflow from Oregon to Arizona across the most recent available tax-year datasets. These are not low-income relocations. They are homeowner-class moves—households with equity, earned income, and a financial incentive to reduce their annual tax burden.
USPS Change-of-Address data corroborates the directional trend, showing net forwarding volumes from the Portland metro area to Phoenix Valley zip codes across multiple measurement periods.
A: Yes. According to multiple cost-of-living indices benchmarked to BLS consumer expenditure data, Portland’s overall cost of living runs approximately 20–25% higher than Phoenix’s. The largest contributors are housing costs and Oregon’s combined state and local income tax burden, which can reach 13.9% on earned income for Portland-area residents, versus Arizona’s flat 2.5% rate.
A: Oregon levies a graduated state income tax from 4.75% to 9.9%. Portland-area residents also pay Multnomah County and Metro income taxes that can add up to 4 additional percentage points. Arizona’s flat income tax rate is 2.5%. A household earning $150,000 in Portland typically faces a combined Oregon state and local income tax liability roughly $9,000–$10,000 higher than the same household would pay in the Phoenix Valley, based on published rate schedules. Source: Tax Foundation, 2025.
A: Partially, but not fully for most income levels. Oregon has no state or local sales tax. Arizona’s combined average rate runs approximately 8.37%. On $35,000 in annual taxable purchases, Arizona’s sales tax adds roughly $2,900 per year. That partially offsets the income tax savings of moving to Arizona—but for most earned-income households at and above $130,000, the net combined tax advantage still favors Arizona by $6,000–$7,000 or more annually.
A: The Portland metro median sale price was approximately $537,000 in early 2025 (RMLS data). In the Phoenix Valley at the same price point, buyers routinely access 2,400–3,200 square feet of newer construction on larger lots in master-planned communities in Gilbert, Chandler, and Mesa—significantly more square footage and newer construction than comparably priced Portland-area properties typically offer.
