This page runs the actual numbers across housing, income tax, property tax, sales tax, and general consumer prices — so Inland Empire homeowners moving to the Phoenix Valley can model the full financial picture before deciding. Every figure is sourced to an approved government or MLS dataset. No estimates without attribution. No projections presented as facts.
This page applies one filter to every cost category: what does a purchasing homeowner in the Inland Empire actually spend, and what does a purchasing homeowner in the Phoenix Valley actually spend for the same category — at current market rates, from approved sources?
Each section closes with a quantified annual or monthly savings figure. The final section (Section 11) synthesizes all five into a combined annual household cost picture.
Purchase price, price per square foot, monthly P&I obligation
California vs. Arizona, graduated vs. flat rate
What a new purchase costs in each market annually
Combined state + county + city rates across both markets
BLS CPI comparison, Inland Empire vs. Phoenix
The purchase price comparison across the three Inland Empire origin markets and the Phoenix Valley destination produces a range of outcomes depending on county of origin:
| Market | Median Home Price | Source / Date |
|---|---|---|
| Riverside County, CA | ~$635,000 | CAR, November 2025 |
| San Bernardino County, CA | ~$515,000 | CAR / SB County Community Indicators, Jan–Dec 2025 |
| Maricopa County, AZ | ~$485,000 | ARMLS, 2025 |
| Riverside → Arizona Gap | ~$150,000 less | Price advantage in AZ |
| SB County → Arizona Gap | ~$30,000 less | Near parity; other categories carry the financial case |
For Riverside County homeowners — where the median purchase price premium over Arizona is approximately $150,000 — the housing price gap alone drives a materially lower loan amount, lower monthly obligation, and more retained equity after purchase. On a $635,000 California purchase vs. a $485,000 Arizona purchase, both at 20% down and 6.5% 30-year fixed, the monthly principal and interest difference is approximately $760 per month — $9,120 per year in P&I savings before taxes, insurance, or HOA are added.
For San Bernardino County homeowners, near-parity on purchase price means the primary financial advantages shift to (1) price per square foot, (2) property tax rate differential on a new purchase, and (3) the state income tax delta. Those advantages are explored in detail below.
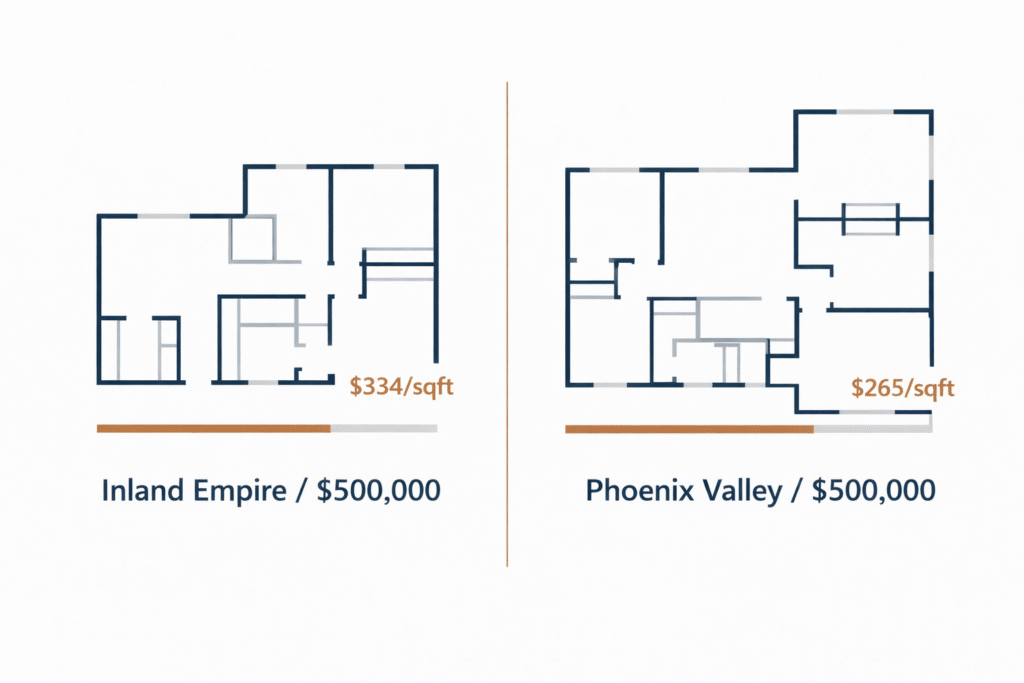
Price parity on total purchase price does not mean parity on what a dollar buys in physical living space. The price-per-square-foot differential tells a separate story:
| Market | Price / Sq. Ft. | Source / Date |
|---|---|---|
| Riverside County, CA | ~$367 | CAR / MLS, late 2025 |
| San Bernardino County, CA | ~$334 | CAR / MLS, late 2025 |
| Maricopa County, AZ | ~$265 | ARMLS, 2025 |
At a $500,000 budget, a Riverside County buyer receives approximately 1,362 square feet. The same $500,000 in Maricopa County delivers approximately 1,887 square feet — 525 additional square feet, or 38% more physical living space per dollar spent.
For San Bernardino County buyers, the $500,000 budget buys approximately 1,497 square feet locally versus 1,887 square feet in Maricopa County — 390 additional square feet, or 26% more space per dollar.
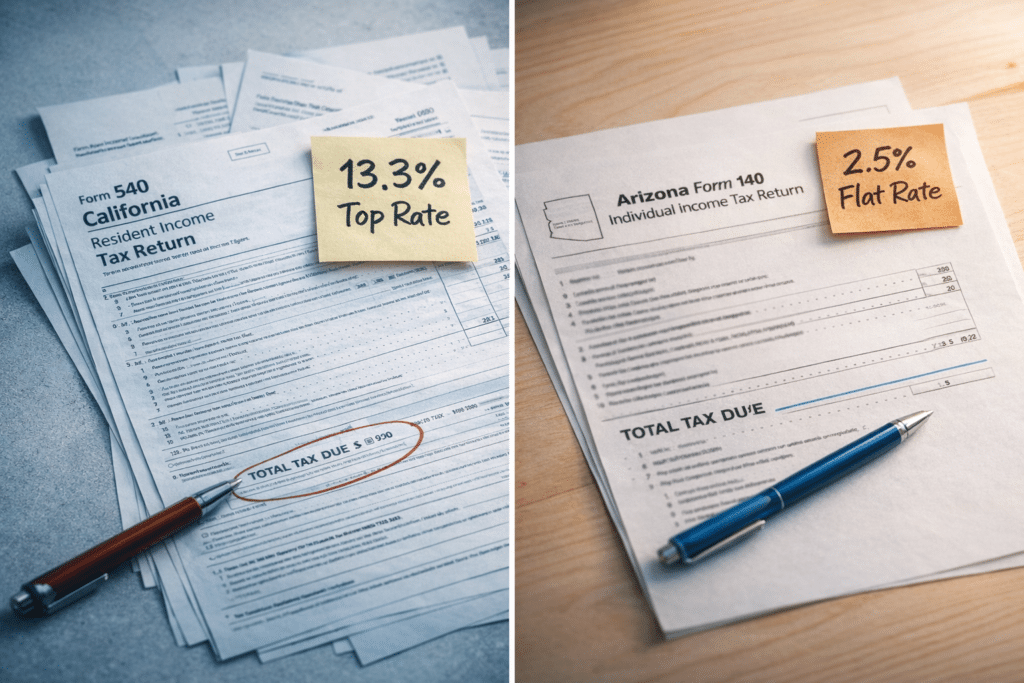
This is the most persistent annual cost differential between the Inland Empire and the Phoenix Valley, because it applies to every dollar of earned income, every year, for as long as the household remains a California resident.
California operates a nine-bracket progressive income tax system. As of 2025, marginal rates begin at 1% and climb to 12.3% — with an additional 1% surcharge on income above $1,000,000, bringing the all-in top rate to 13.3%, the highest marginal state income tax rate in the country (Tax Foundation, 2025). California also imposes a 1.1% payroll tax on wage income, bringing the total effective ceiling to 14.4% for high-income wage earners.
Arizona operates a flat income tax of 2.5% on all taxable income — the lowest flat rate of any state with an income tax in the country (Tax Foundation, 2025). There are no brackets, no phase-outs, and no graduated surcharges.
At the income levels typical of Inland Empire homeowners — households earning between $85,000 and $150,000 annually — the California marginal bracket runs from 9.3% to 10.3%, with effective rates (total state income tax divided by gross income) typically landing between 6% and 9% depending on deductions, filing status, and credits.
For planning purposes, the annual state income tax savings from relocating to Arizona at selected income levels:
| Annual Household Taxable Income | Est. CA State Income Tax | AZ State Income Tax | Est. Annual Savings in AZ |
|---|---|---|---|
|
$88,294 (SB County median per Census ACS 2024) |
~$6,000–$7,400 | ~$2,207 | ~$3,800–$5,200 |
|
$93,172 (Riverside County median per Census ACS 2024) |
~$6,500–$8,100 | ~$2,329 | ~$4,200–$5,800 |
| $120,000 | ~$9,000–$10,500 | ~$3,000 | ~$6,000–$7,500 |
| $150,000 | ~$12,500–$14,500 | ~$3,750 | ~$8,750–$10,750 |
Note: CA estimates apply progressive 2025 brackets (Tax Foundation) with approximate standard deductions. AZ estimate at flat 2.5% on approximate taxable income. For planning purposes only — consult a qualified tax professional for advice specific to your household situation. Sources: Tax Foundation, 2025; Census ACS 2024.
The compounding effect of this annual delta is significant. At a $6,000 annual income tax savings, a relocating Inland Empire household retains an additional $60,000 over ten years — capital that was being transferred to Sacramento and is now available for mortgage paydown, investment, or liquid savings.
Source: Tax Foundation, 2025
Tax Foundation, 2025
For long-tenured Inland Empire homeowners, California’s Proposition 13 has kept their current property tax bill at a fraction of the market value of their home. A homeowner who purchased in San Bernardino County in 2005 for $340,000 is still being taxed on an assessed value near that purchase price — not on today’s $515,000 market value.
That protection disappears the moment a homeowner sells and buys again — whether in California or Arizona. In both states, a new purchase resets the assessed value to the current purchase price.
The question is: what rate applies to that reset purchase price?
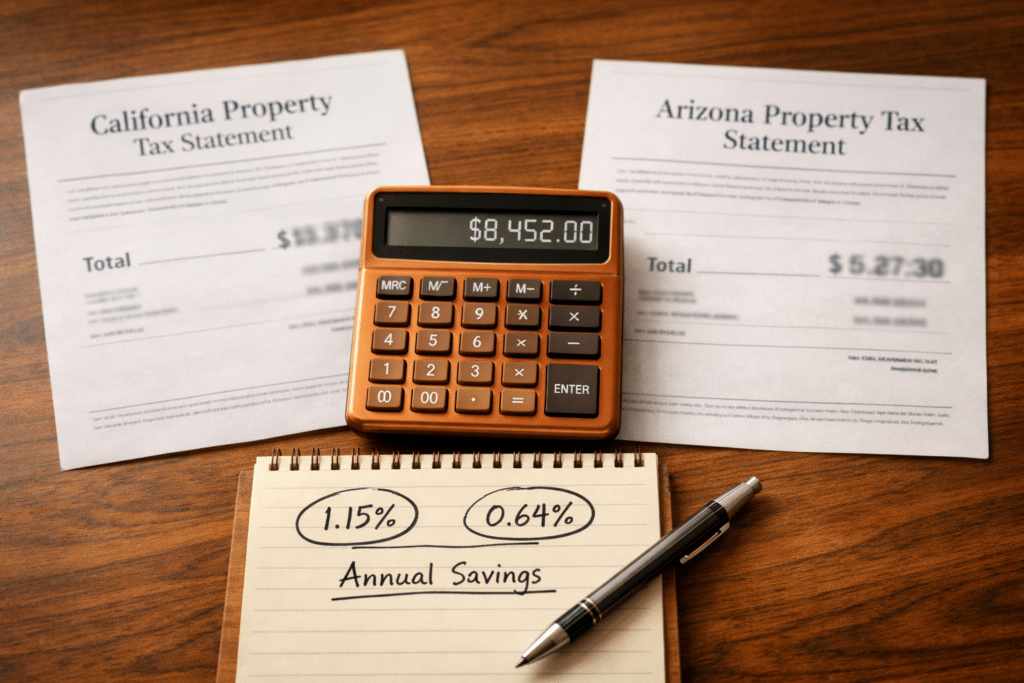
In Riverside County and San Bernardino County, the effective property tax rate on a new purchase — combining California’s base 1% statutory rate with local assessments, special districts, and voter-approved bond levies that vary by jurisdiction — runs approximately 1.1% to 1.2% (Tax Foundation analysis; Victor Valley Times / BlockShopper Q4 2024 effective rate study for San Bernardino County; IRS and Tax Foundation data for Riverside County).
In Maricopa County, the effective residential property tax rate was approximately 0.64% in FY2024 (Maricopa County Treasurer, Popular Annual Financial Report FY2024).
| Market | Eff. Rate (New Purch.) |
On $500K Purchase |
Annual Bill |
|---|---|---|---|
| Riverside Co., CA | ~1.10–1.20% | $500,000 | ~$5,500–$6,000 |
| San Bern. Co., CA | ~1.15–1.20% | $500,000 | ~$5,750–$6,000 |
| Maricopa Co., AZ | ~0.64% | $500,000 | ~$3,200 |
| Annual Savings vs. IE on same purchase | ~$2,300–$2,800 |
NOTE: Effective rates include local assessments and bond measures that vary significantly by jurisdiction within each county. These figures are estimates for planning purposes. Consult local assessor data or a tax professional for location-specific figures.
A $2,300–$2,800 annual property tax savings is equivalent to approximately $192–$233 per month in reduced housing cost — purely from the tax-rate differential at the same purchase price. Over a ten-year ownership period, that differential produces $23,000–$28,000 in cumulative savings at the $500,000 reference price, scaling proportionally with the actual purchase price.
Sales tax is the one cost category in this analysis where the Inland Empire and the Phoenix Valley are most similar — and intellectual honesty requires saying so.
Combined state, county, and city sales tax rates across the Inland Empire vary significantly by jurisdiction. The city of San Bernardino applies a combined rate of 8.75% (state 7.25% + county 1.00% + special district 0.50% + additional city 0.00%). Rates elsewhere in San Bernardino County range from 7.75% to 10.25%, depending on local voter-approved measures. In Riverside County, the combined rate ranges from 6.25% (unincorporated areas) to 9.25% in certain jurisdictions (California Department of Tax and Fee Administration, 2025).
In the Phoenix Valley, the combined rate in the city of Phoenix is 8.6% (Arizona state 5.6% + Maricopa County 0.7% + City of Phoenix 2.3%). In Valley suburbs such as Gilbert, Chandler, and Surprise, combined rates typically run between 7.8% and 8.3% — modestly lower than Phoenix proper.
| Jurisdiction | Combined Sales Tax Rate | Source / Date |
|---|---|---|
| City of San Bernardino, CA | 8.75% | CDTFA, 2025 |
| San Bernardino County range | 7.75%–10.25% | CDTFA, 2025 |
| Riverside County range | 6.25%–9.25% | CDTFA, 2025 |
| City of Phoenix, AZ | 8.60% | City of Phoenix, 2025 |
| Gilbert / Chandler / Surprise | ~7.80%–8.30% | AZ Dept. of Revenue, 2025 |
The bottom line: sales tax rates between the Inland Empire and the Phoenix Valley are broadly comparable when combined rates are compared. Buyers relocating from lower-rate IE jurisdictions to Phoenix proper will see a modest increase; those moving to Phoenix Valley suburbs may see rates comparable to or modestly lower than their current rate. Sales tax is not a primary financial driver in the IE- to-Arizona relocation calculation — the income tax and property tax differentials carry substantially more annual dollar weight.
One structural Arizona advantage exists within sales tax: Arizona exempts most unprepared food (groceries) from state sales tax. California does not impose state sales tax on unprepared food either, so this creates near-parity on grocery purchases specifically. Both states have exceptions and local overlays — consult the Arizona Department of Revenue for current exemption detail.
The U.S. Bureau of Labor Statistics publishes Consumer Price Index data for both the Riverside-San Bernardino-Ontario metropolitan area (covering Riverside and San Bernardino Counties) and the Phoenix-Mesa-Scottsdale metropolitan area (covering Maricopa and Pinal Counties). These metro-level CPI figures allow a direct year-over-year price comparison in the categories that affect everyday household budgets.
As of November 2025, the BLS reported that the Riverside-San Bernardino-Ontario area’s headline CPI-U (all urban consumers) had increased 4.5% year-over-year — nearly double the national headline rate of 2.7% for the same period (BLS, via USAFacts, citing December 2025 release data). Core inflation (all items less food and energy) for the Riverside area was 4.6% year-over-year as of November 2025.
For the Phoenix-Mesa-Scottsdale area, the BLS December 2025 release reported all-items-less-food-and-energy (core) inflation of 2.1% year-over-year — food prices up 2.3% year-over-year and energy up 4.2% year-over-year (BLS, December 2025 Phoenix area CPI release).
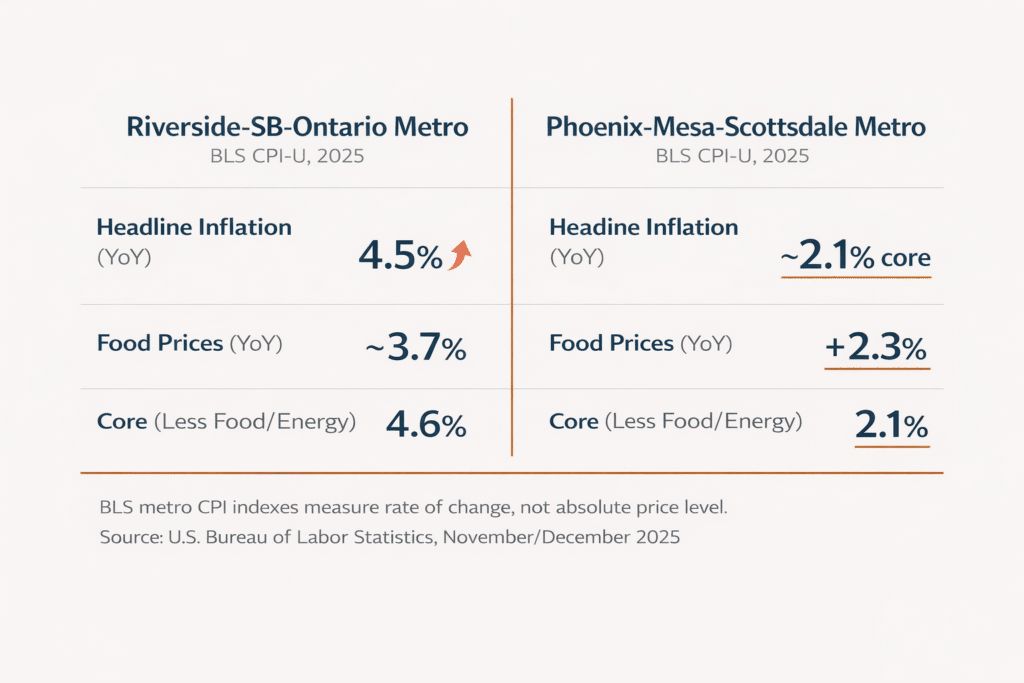
| CPI Category | Riverside-SB-Ontario Metro (Nov 2025 YoY) | Phoenix-Mesa-Scottsdale Metro (Dec 2025 YoY) |
|---|---|---|
| All Items (Headline) | +4.5% | N/A (bi-monthly pub.) |
| Core (Less Food/Energy) | +4.6% | +2.1% |
| Food | ~+3.7% (Mar 2025 YoY) | +2.3% |
| Energy | Variable | +4.2% |
Source: U.S. Bureau of Labor Statistics — Riverside-SB-Ontario CPI-U release, November 2025 (via USAFacts, Dec. 2025); Phoenix-Mesa-Scottsdale CPI-U release, December 2025.
NOTE: Metro CPI indexes measure the rate of price change over time within each metro area — they do not directly measure the absolute price level between two cities. An area with higher CPI growth is experiencing faster price increases, not necessarily higher absolute prices at any given moment. BLS cautions that local metro indexes have smaller sample sizes and more sampling variability than the national index.
The CPI data provides one clear signal: price growth in the Riverside-San Bernardino-Ontario metropolitan area has been running at more than double the rate of core inflation growth in Phoenix. A household that relocates from the Inland Empire to the Phoenix Valley is moving from a market where the price of goods and services has been escalating at 4.5% per year to one where core prices are rising at 2.1% per year. On a $60,000 annual household consumption budget (approximately consistent with median IE household expenditure levels), a 2.4 percentage-point reduction in the rate of consumer price growth represents approximately $1,440 per year in slower cost escalation — a compounding advantage that grows with the divergence in CPI trajectories.
This differential does not mean Phoenix is necessarily cheaper in absolute terms for every item today. It means the IE homeowner who relocates to Phoenix is moving out of a high-rate-of-increase cost environment into a more stable one.
A mid-income Inland Empire homeowner — let us use a Riverside County household earning $120,000 annually and purchasing a $500,000 home in Arizona versus a $600,000 comparable Riverside County home at current median prices — realizes savings across the following categories simultaneously:

| CPI Category | Riverside-SB-Ontario Metro (Nov 2025 YoY) | Phoenix-Mesa-Scottsdale Metro (Dec 2025 YoY) |
|---|---|---|
| All Items (Headline) | +4.5% | N/A (bi-monthly pub.) |
| Core (Less Food/Energy) | +4.6% | +2.1% |
| Food | ~+3.7% (Mar 2025 YoY) | +2.3% |
| Energy | Variable | +4.2% |
Notes: Housing P&I calculation based on 20% down, 6.5% 30-yr fixed, ~$480K loan (AZ) vs. ~$480K loan (CA at $600K, 20% down). Actual savings vary by purchase price, down payment, mortgage rate, income, deductions, and local AZ jurisdiction. For planning purposes only. Sources: ARMLS 2025; CAR 2025; Tax Foundation 2025; Maricopa County Treasurer FY2024; BLS November/December 2025.
Every category is calculated independently from approved data sources. The five savings streams are not additive in a mechanical sense — a household’s actual combined savings depends on its specific purchase price, income level, deductions, and chosen Arizona community. But each stream is real, recurring, and compounding. A household that captures all five simultaneously — purchase price savings, income tax savings, property tax savings, comparable sales tax, and slower consumer price growth — is operating from a materially stronger financial position from year one onward.
Over ten years, at the low end of the estimates above, that household retains approximately $175,000 more in capital than it would have as a continuing California homeowner — not counting equity appreciation in the Arizona asset.
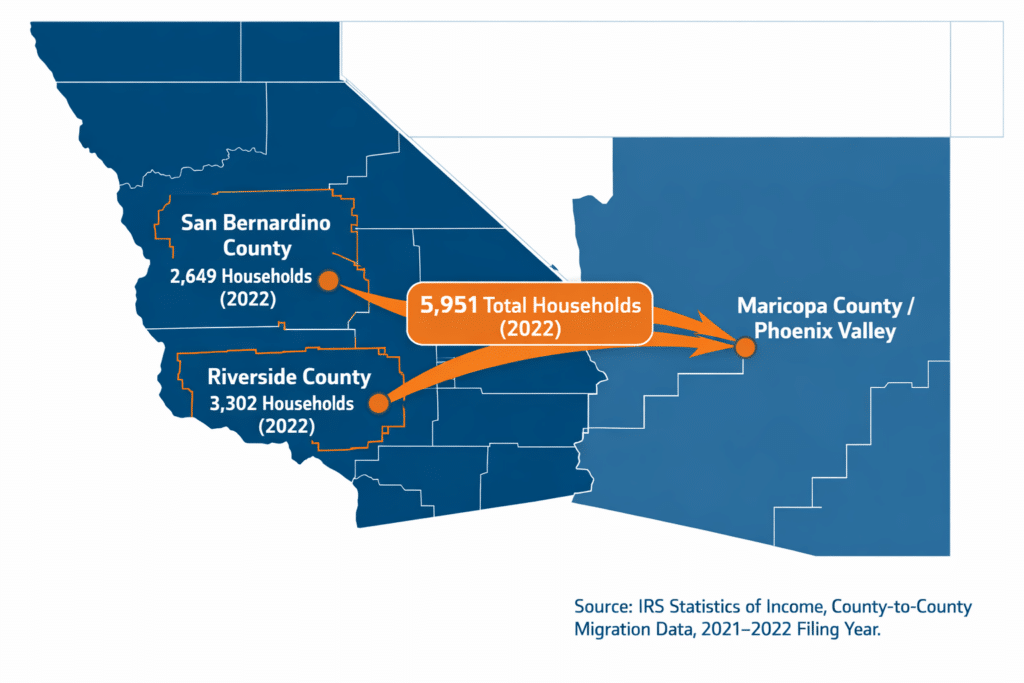
The IRS Statistics of Income county-to-county migration data for the 2021–2022 filing year — the most recent year for which complete data is available — documents the following household flows from the Inland Empire to Maricopa County:
Riverside County → Maricopa County: 3,302 households
San Bernardino County → Maricopa County: 2,649 households
Inland Empire total → Maricopa County: 5,951 households
In a single filing year, nearly 6,000 Inland Empire households executed the financial calculation this page describes — and relocated to Maricopa County. These are income-tax-filing households, not transient renters. They represent homeowners who ran the math and acted on it.
Combined Inland Empire origin households exceed those from any other single California metro area in the IRS dataset for the same year, making the Inland Empire–to–Maricopa corridor one of the highest-volume California-origin relocation corridors in the country.
Our brokerage partner, West USA Realty, represents buyers relocating to Gilbert, Chandler, Scottsdale, and all Phoenix Valley communities. Connect directly with a licensed Arizona agent at westusa.net.
Gilbert’s new-construction inventory, established master-plan infrastructure, and Loop 202 access make it the most frequent landing point for IE equity buyers targeting the east Valley. Homes priced $450,000–$650,000 deliver 2,200–3,200 square feet with three-car garages and pool-ready lots — outcomes that are not achievable at equivalent price points in either Riverside or San Bernardino County.
Mesa’s housing inventory spans entry-level to move-up, making it accessible for San Bernardino County buyers at near-parity prices as well as for Riverside County buyers with $100,000–$150,000 in purchase price upside to deploy. Established and new-construction stock available.
For IE buyers whose primary objective is maximizing lot size and outdoor space per equity dollar, the West Valley delivers the strongest land-per-dollar outcome in the Phoenix metro — with purchase prices that regularly land below the Maricopa County median.