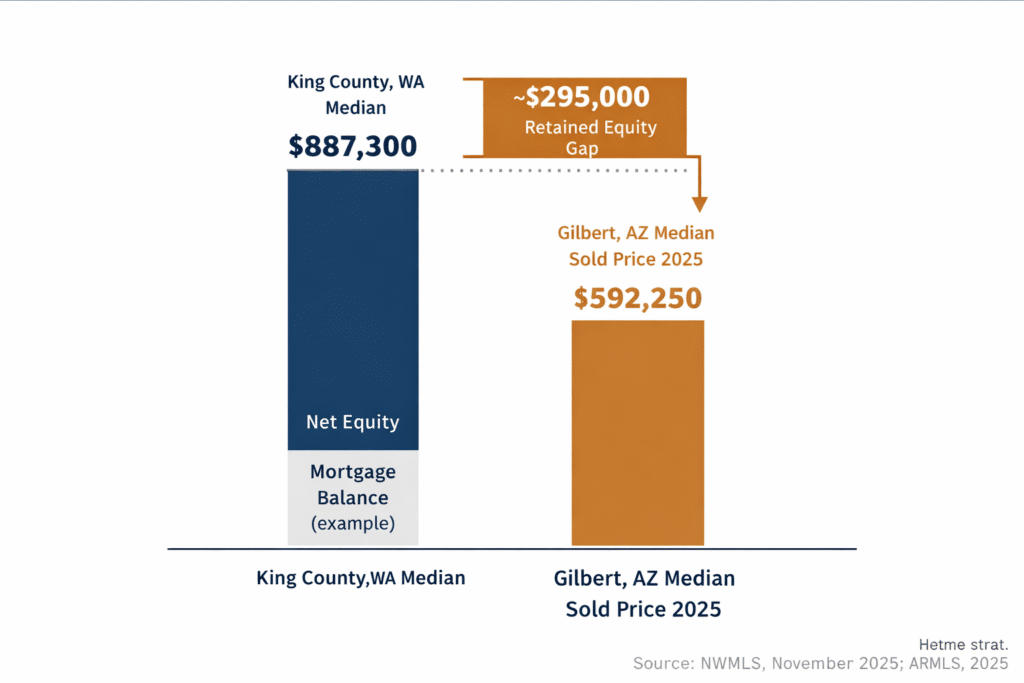
King County’s median home held at $887,300 in October 2025, per the Northwest Multiple Listing Service. Gilbert’s 2025 median sold price was $592,250 per ARMLS-sourced data. That $295,000+ gap does not disappear on closing day it converts into retained equity, a materially lower annual property tax bill, and a physical property that delivers more finished square footage and outdoor infrastructure than King County’s comparable price band.
Of all the primary Phoenix Valley destination markets, Gilbert offers Seattle homeowners the most direct equity-gap argument. Unlike Scottsdale, which trades at a price point near King County’s median, Gilbert delivers a material financial arbitrage: the difference between what a King County home sells for and what a Gilbert home costs is large enough to function as a second financial event independent of property and income tax savings.
Here is the framework:
King County’s median home price held at $887,300 in October 2025, per NWMLS data reported in November 2025. Gilbert’s full-year 2025 median sold price for single-family homes was $592,250, per ARMLS-based market reporting. The spread: approximately $295,000 before accounting for the buyer’s existing mortgage balance.
For a King County homeowner who purchased before 2018 a large segment of the current seller class given the lock-in effect documented in Seattle housing data the net proceeds after paying off a remaining mortgage balance are substantial. A homeowner who purchased a Seattle-area home for $600,000 in 2016, financed $480,000, and has paid down to a $380,000 balance has approximately $507,000 in equity on today’s $887,300 median value. Taking $592,250 as the Gilbert purchase price and assuming a conventional 20% down payment ($118,450), that household completes the transaction with approximately $388,550 in retained cash a financial position with no equivalent in the Pacific Northwest housing market at the same monthly cost structure.
This is the structural case for Gilbert: not that it is the Valley’s most premium address, but that it delivers a complete, high-quality residential product at a price point that leaves Seattle equity intact.
King County median ($887,300) minus Gilbert 2025 median sold price ($592,250)
Source: Northwest Multiple Listing Service (NWMLS), November 2025; ARMLS 2025 annual data
On a representative sale with a paid-down mortgage, this gap translates into substantial retained cash on the day of purchase.
Source: NWMLS, November 2025; ARMLS 2025 annual market data.
The equity gap is a one-time financial event. The property tax and income tax differences are recurring.
Property Tax: King County’s effective property tax rate is 0.84% of assessed value, and the median homeowner in King County pays approximately $7,292 per year, per King County Assessor data and SmartAsset’s 2025 analysis. Maricopa County’s effective property tax rate is 0.52%, per the Maricopa County Treasurer, FY 2025.
On a $592,250 Gilbert home, the annual Maricopa County property tax is approximately $3,080. The equivalent annual tax on a $887,300 King County home at the 0.84% effective rate would be approximately $7,453. The annual difference: approximately $4,373.
Over a ten-year holding period, that delta represents approximately $43,730 in cumulative retained capital before accounting for any appreciation in the Arizona property.
Estimated annual property tax savings on a representative transaction: King County ($887,300 home at 0.84%) vs. Gilbert ($592,250 home at 0.52%). 10-year cumulative value: ~$43,730.
Source: King County Assessor, 2025; Maricopa County Treasurer, FY 2025; NWMLS, November 2025; ARMLS 2025. Note: Actual bills vary by city, school district, and special levies.

Income and Capital Gains Taxes: Washington State has no personal income tax, which distinguishes Seattle homeowners from California and Oregon origin markets. However, Washington’s capital gains excise tax applies to long-term investment gains above a $278,000 standard deduction at a rate of 7%, rising to 9.9% on gains exceeding $1 million above the deduction, per Washington Department of Revenue (2025). The primary residence sale is fully exempt from this tax.
Arizona’s flat income tax rate is 2.5%, per the Arizona Department of Revenue, confirmed for tax year 2025. For Seattle homeowners with material investment portfolios, stock options, or equity compensation positions they plan to liquidate in the years following a move, establishing Arizona residency before those liquidation events reduces their exposure from Washington’s 7–9.9% capital gains tier to Arizona’s 2.5% flat rate.
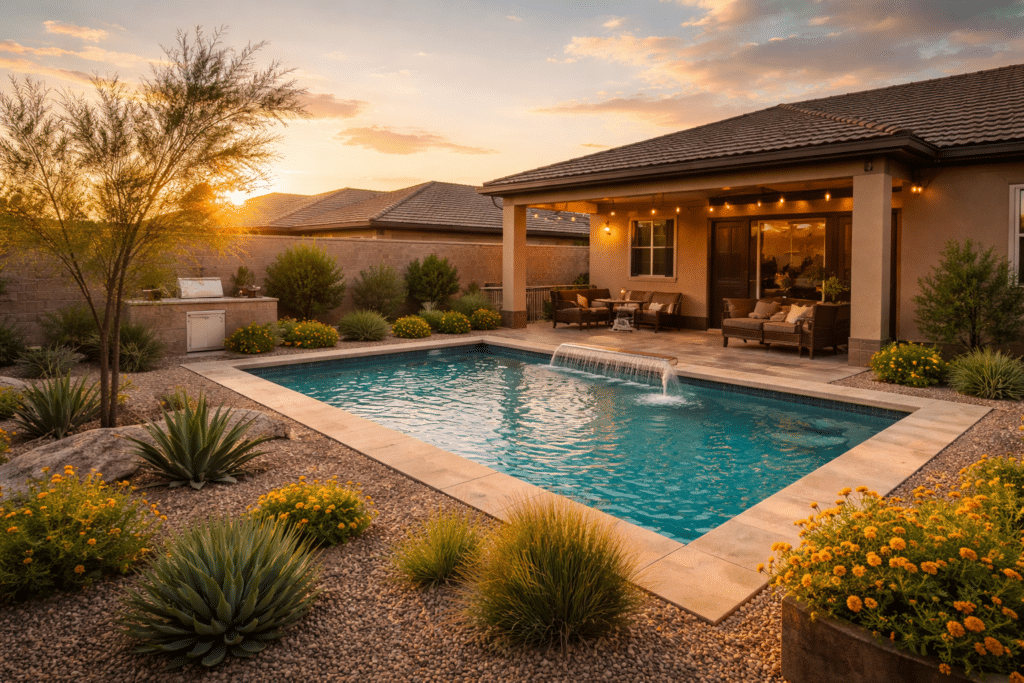
Gilbert’s residential product at the $550,000 to $650,000 price band is structurally different from what King County delivers at the same price point. This is not a marginal difference in finish level it is a categorical difference in lot size, outdoor infrastructure, and HOA-managed environment.
Gilbert’s residential landscape is dominated by master-planned communities, many built since 2005 with HOA infrastructure as a standard component. At the $590,000 median price point, a typical single-family purchase in Gilbert delivers:
For context: $590,000 in the greater Seattle market in 2025 purchases a median- positioned single-family home in outer King County or inner Snohomish County typically 1,500 to 1,900 square feet on a 4,000 to 6,000 square foot urban or suburban lot, with minimal or no covered outdoor infrastructure, constrained rear yard depth, and no community pool access.
A meaningful percentage of Gilbert’s $550K-$700K inventory in 2025 is new construction from regional builders active across the Southeast Valley. For Seattle homeowners accustomed to purchasing homes built in the 1920s-1960s with deferred maintenance obligations, Gilbert’s new-build inventory offers an operationally different product: sealed envelope construction, current energy code compliance, structural warranties, and a price premium over comparable resale inventory that remains well within the reach of King County equity.
Compare to King County’s comparable price range: approximately 1,500–1,900 square feet, older construction, constrained outdoor space.
Source: ARMLS, 2025 YTD market data; November 2025 Gilbert Housing Market Report.
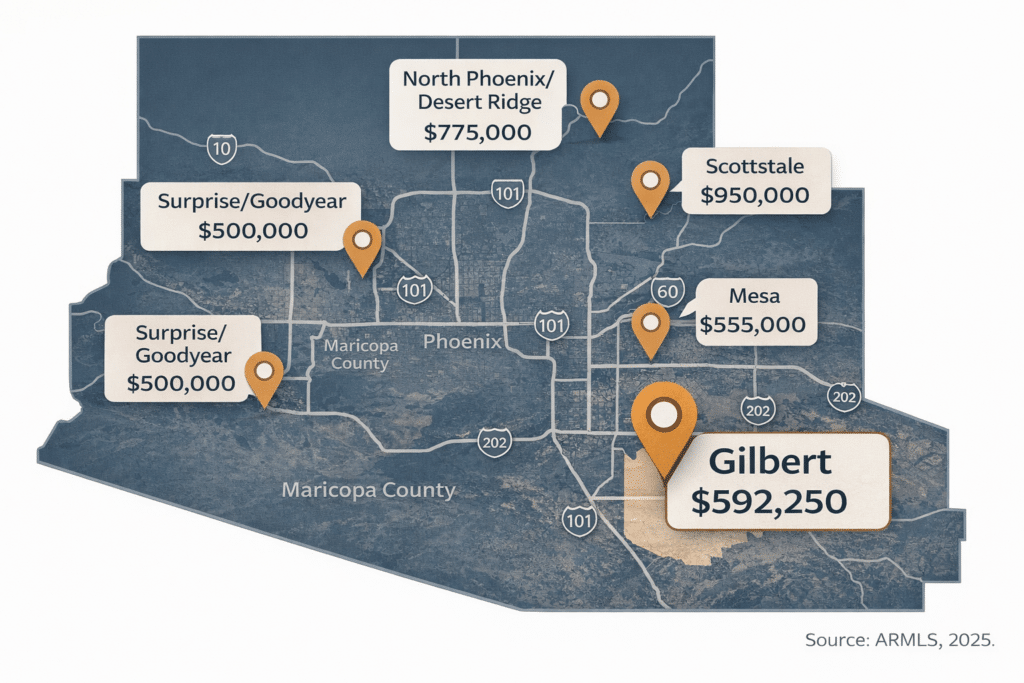
Gilbert occupies the Southeast Valley, anchored by the Loop 202 freeway corridor and positioned between Mesa to the northwest, Chandler to the west, and Queen Creek and San Tan Valley to the southeast. Its growth arc over the past two decades has produced one of the most densely master-planned residential landscapes in the Phoenix Valley.
Gilbert’s 2025 median sold price of $592,250 (full year, ARMLS data) makes it the most precisely positioned destination in the Valley for Seattle homeowners seeking the maximum equity gap without sacrificing community infrastructure quality.
Gilbert’s position in this table is deliberate. It offers the largest equity gap among the Valley’s premium master-planned communities while remaining in a tier that delivers HOA infrastructure, quality-constructed housing stock, and proximity to the East Valley’s commercial and employment base.
Greater Phoenix’s overall active listing inventory stood at 24,358 homes in January 2026 up 9.63% year-over-year per ARMLS STAT (February 2026 release) with the overall metro median at $444,740. Gilbert’s premium over the metro median is a function of product quality, not demand scarcity.
| Community | Approx. Median Price | Equity Gap vs. KC Median |
|---|---|---|
| Scottsdale | ~$900,000–$995,000 | Near-peer; advantage is property tax and investment tax, not price gap |
| North Phoenix / Desert Ridge | ~$550,000–$700,000 | $187K–$337K gap |
| Gilbert | ~$592,250 (2025 YTD) | ~$295,000 gap vs. KC median |
| Chandler | ~$540,000 | ~$347,000 gap |
| Mesa | ~$490,000 | ~$397,000 gap |
| Surprise / Goodyear | ~$430,000 | ~$457,000 gap |
Source: ARMLS, Scottsdale REALTORS, Phoenix REALTORS, 2025. King County median reference: NWMLS, October 2025 ($887,300).
The University of Arizona’s Eller College of Management’s analysis of IRS Statistics of Income data specifically identifies Seattle among the metropolitan regions contributing documented inbound migration to Arizona — alongside Los Angeles, San Diego, Chicago, Portland, and Detroit. IRS state-to-state data (2021–2022 filing year, the most recent complete dataset) confirms Washington as a consistent origin state for Arizona inbound migrants across income brackets, particularly in the $100,000–$200,000+ household income range.
Tax Foundation analysis of the same IRS dataset identifies Arizona among the top five destination states for households with adjusted gross income above $200,000 — a profile that precisely matches the King County homeownership class, where median home values above $887,000 imply significant household wealth positions.
Allied Van Lines’ 2025 U.S. Migration Report independently identifies Seattle among the metro areas generating the highest volume of outbound professional moves nationally, alongside Los Angeles, San Diego, and Chicago.
For the Gilbert-specific case, the Southeast Valley’s position as a family- formation destination means that Seattle households with children have chosen Gilbert specifically for its community infrastructure, civic amenity concentration, and Southeast Valley location relative to Chandler and Tempe’s employment base. The financial math initiates the decision; the physical inventory closes it.
confirms Washington among the consistent origin states for Arizona inbound migration, with Arizona ranking among the top five destinations for households with $200,000+ AGI.
Source: IRS Statistics of Income, 2021–2022; Tax Foundation, 2024; University of Arizona Eller College of Management, November 2024.
