Chandler’s 2025 full-year median sold price is $565,000. An LA County home at the December 2025 median of $890,910 produces roughly $270,000–$285,000 in retained equity at that purchase price — before accounting for the annual income tax savings that begin the day you file your first Arizona return.
Chandler sits in a specific position in the Phoenix Valley price stack: low enough to unlock meaningful equity for most California sellers, but deep enough in inventory to provide real option value across multiple price tiers. At the 2025 full-year median of $565,000, California sellers are purchasing far below coastal price points and retaining the difference as deployable capital.
The math is consistent. Take the California sale price, subtract transaction costs (typically modeled at ~6% for listing-side commissions and closing costs), then compare net proceeds to the Chandler purchase price plus standard Arizona closing costs. The remaining gap is retained equity — money that was previously trapped in a California home and is now liquid, investable, or usable as a mortgage reduction.
For long-term California owners, this is not abstract. It often determines whether the Arizona purchase carries a conventional mortgage, a sharply reduced payment, or no mortgage at all. Layer in the income tax delta: a $200,000 household often pays approximately $10,000–$13,000 less in annual state income tax in Arizona than in California, recurring every year.
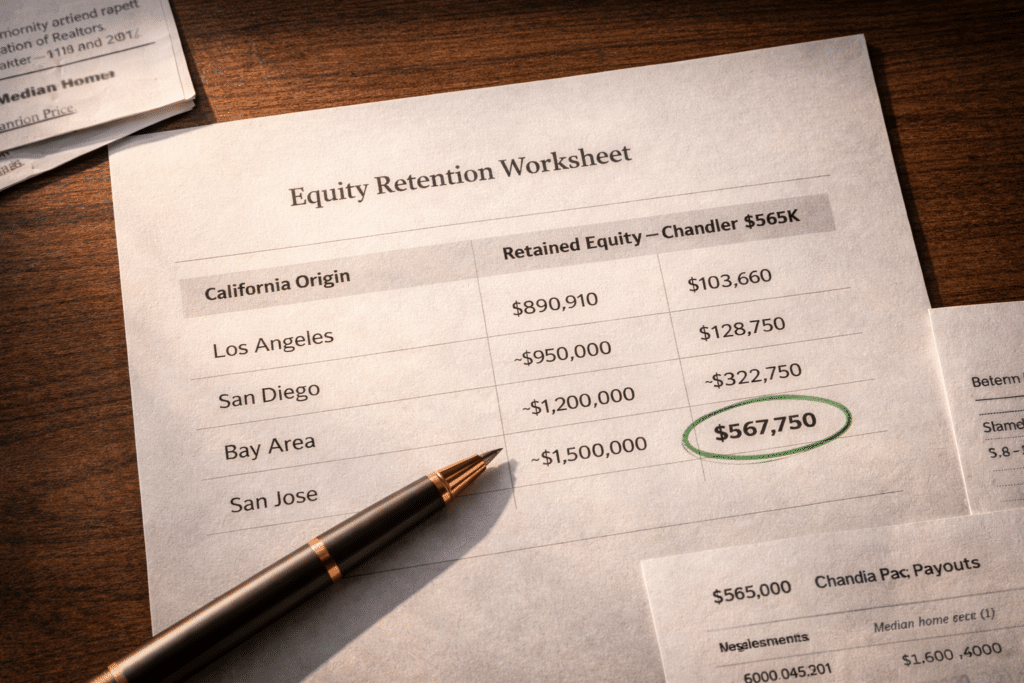
The table below maps four California origin markets against a Chandler purchase at the 2025 full-year median of $565,000. Net proceeds assume ~6% transaction costs on the California sale. Arizona closing costs (approx. $8,000–$12,000) are deducted from retained equity.
These retention figures assume a purchase at the Chandler median. At higher Chandler price points, the gap compresses but remains substantial. A Bay Area household purchasing at $700,000 retains roughly $390,000–$410,000 after transaction costs. A San Jose household purchasing at $850,000 retains roughly $520,000–$540,000.
| California Origin Market | CA Median (2025) | Est. Net CA Proceeds | Chandler Purchase | Est. Equity Retained |
|---|---|---|---|---|
| Los Angeles County | $890,910 | ~$837,000–$838,000 | $565,000 | ~$270,000–$285,000 |
| San Diego County | ~$950,000 | ~$893,000–$895,000 | $565,000 | ~$315,000–$330,000 |
| SF / Bay Area | ~$1,200,000 | ~$1,128,000 | $565,000 | ~$540,000–$560,000 |
| San Jose / Silicon Valley | ~$1,500,000 | ~$1,410,000 | $565,000 | ~$820,000–$840,000 |
Sources: California Association of Realtors (December 2025); FlexMLS/MLS (Chandler, 2025 full-year); standard Maricopa County closing cost estimates. Figures are estimates. Transaction costs and closing terms vary; consult a licensed professional for a personalized analysis.
At roughly $287–$297 per square foot (FlexMLS/MLS, 2025), Chandler’s $565,000 median equates to approximately 1,900–1,970 square feet at the market midpoint. That figure reflects inventory mix (attached product influencing the median) alongside detached single-family homes. Within detached inventory at this price band, buyers commonly access two- and three-car garage homes with ~6,000–8,000 sq ft lots in HOA-governed communities across central and northwest Chandler.
Chandler is not one uniform housing product. A 1990s resale property and a post-2015 build can share the same city boundary but deliver different build quality, layout standards, and HOA structures. The tier you buy into determines the physical product.
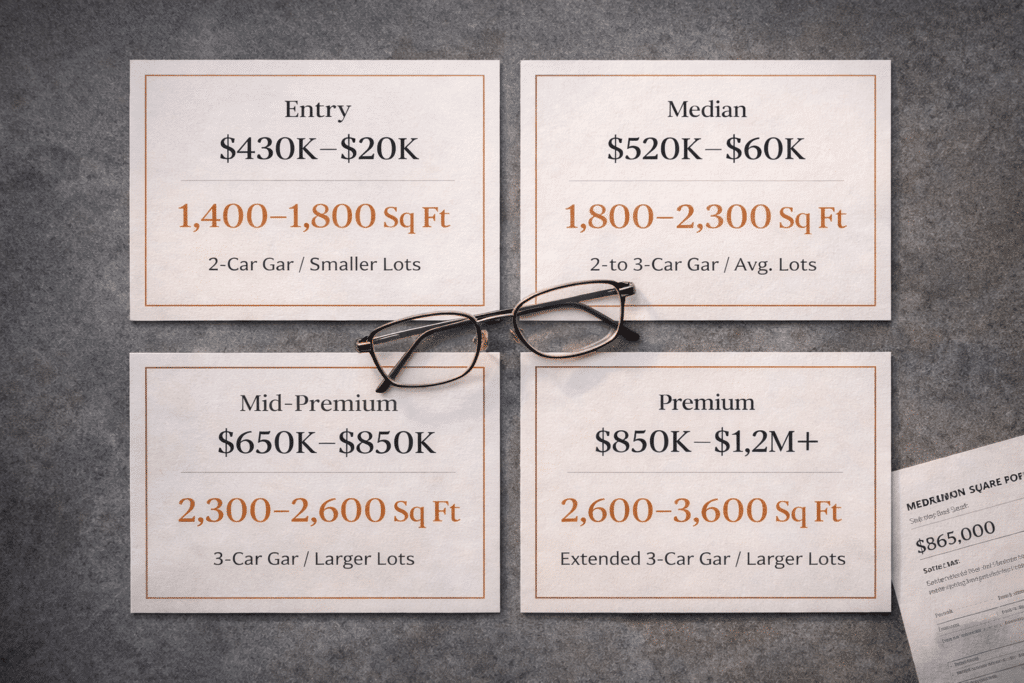
Attached product, townhomes, and smaller-footprint single-family resale. Two-car garages, ~4,500–6,500 sq ft lots. HOA communities with shared pools and ramadas. Faster-moving inventory relative to citywide averages.
Core detached market. Often three-car garages, ~1,900–2,600 sq ft, lots ~6,000–9,000 sq ft. HOA infrastructure commonly includes pools, parks, maintained common areas. Mix of 1990s–2000s resale and post-2010 builds.
~2,400–3,200 sq ft with larger lots; higher-finish resale and newer construction. Some private pools. Larger-lot access becomes more common in southeast Chandler (Ocotillo-area adjacency). Demand is supported by major employment corridors.
~3,200+ sq ft with custom and semi-custom patterns on larger lots, higher-end finishes, and private pools common. Often the entry point for California sellers bringing $1M+ in net proceeds who want a comparable-or-larger footprint.
Price data: FlexMLS/MLS, Chandler housing reporting, 2025 full-year.
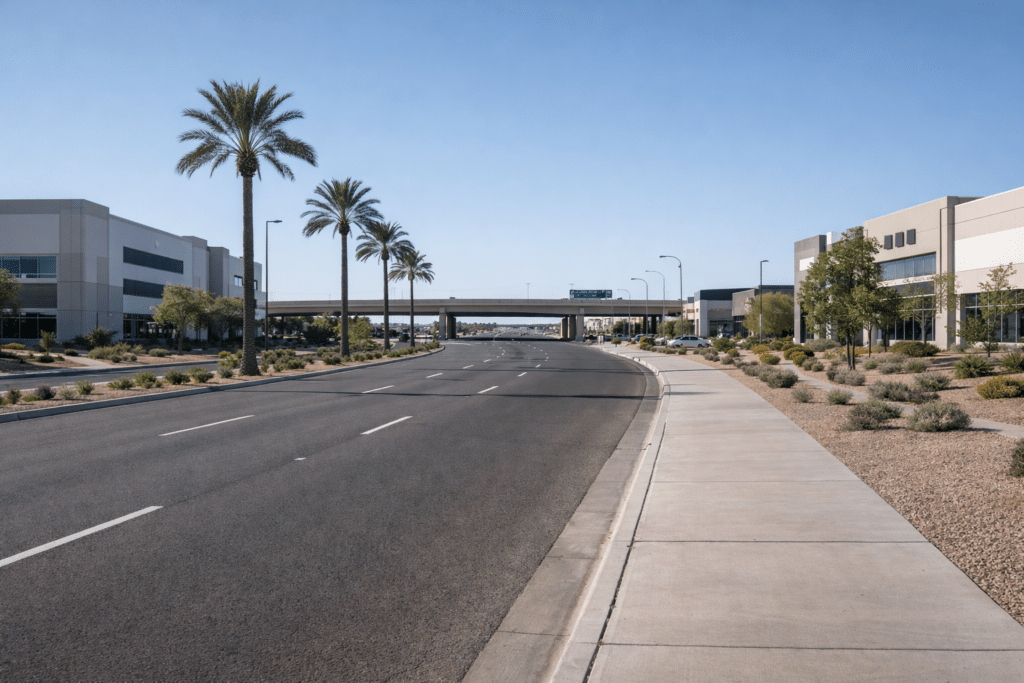
Chandler is one of Arizona’s largest municipalities, with approximately 280,000 residents per U.S. Census Bureau American Community Survey estimates. The city’s East Valley positioning provides direct freeway access through Loop 101 (Price Freeway) and Loop 202 (Santan Freeway), connecting to employment nodes across Chandler, Tempe, and the broader metro.
Housing inventory: Chandler’s housing mix includes a substantial share of post-1990 construction with ongoing new-build pockets, and a high prevalence of HOA-governed communities where CC&Rs govern exterior standards, landscaping requirements, and modification rules — functioning as a structural maintenance framework across the housing stock.
Employment infrastructure: The Price Road corridor is a major employment spine with a concentration of technology, semiconductor, and financial-services operations. Proximity to large employment nodes is relevant to long-term resale demand and inventory absorption.
Location metrics (approximate, varies by neighborhood/route):
Sky Harbor Airport: ~20 miles
Downtown Phoenix: ~18 miles
Downtown Scottsdale: ~12 miles
Freeway access: Loop 101, Loop 202, I-10 connectivity
Lot sizes at the median: ~6,000–9,000 sq ft
Housing stock age: predominantly 1990–2015 with active new construction in SE Chandler
Days on market (2025): ~55–62 days (FlexMLS/MLS, 2025)
HOA prevalence: majority of single-family inventory is HOA-governed with pools, parks, ramadas, and trail systems common
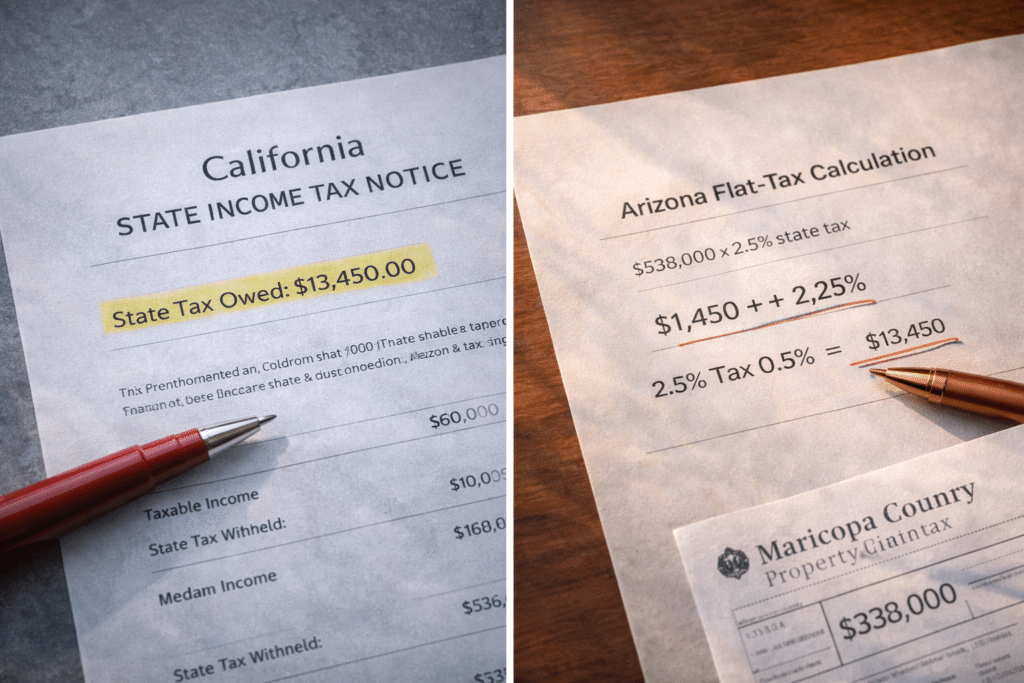
Income tax is the headline, but property tax is what sellers often feel immediately at the point of purchase. Chandler sits in Maricopa County, where the effective property tax rate is ~0.52%, compared to ~0.73% (or higher) across many California counties.
On a $565,000 Chandler purchase at a ~0.52% effective rate, annual property tax is roughly $2,938. A California home assessed at the same value would run roughly $4,125/year at a ~0.73% effective rate — and Prop 13’s capped-assessment benefit ends once a California property is sold. Any new purchase is assessed at full price in both states; Maricopa’s effective rate still tends to produce a lower annual bill.
For a $200,000 household, the combined annual delta (income tax savings plus property tax savings) is roughly $11,200–$14,200 per year. Over a decade, that’s $112,000–$142,000 in additional retained capital, before any investment return.
| Tax Category | California | Arizona / Maricopa County |
|---|---|---|
| Top State Income Tax Rate | 13.3% (+ 1.1% surcharge) | 2.5% flat |
| Effective Property Tax Rate | ~0.73% | ~0.52% |
| Avg Combined Sales Tax | 8.82% statewide avg | 8.40% |
| Property Tax on $565,000 Home | ~$4,125/yr (CA equiv.) | ~$2,938/yr |
| State Income Tax on $200K AGI | ~$15,000–$18,000/yr | ~$5,000/yr |
Sources: Tax Foundation (2025); Maricopa County Treasurer; California Franchise Tax Board.
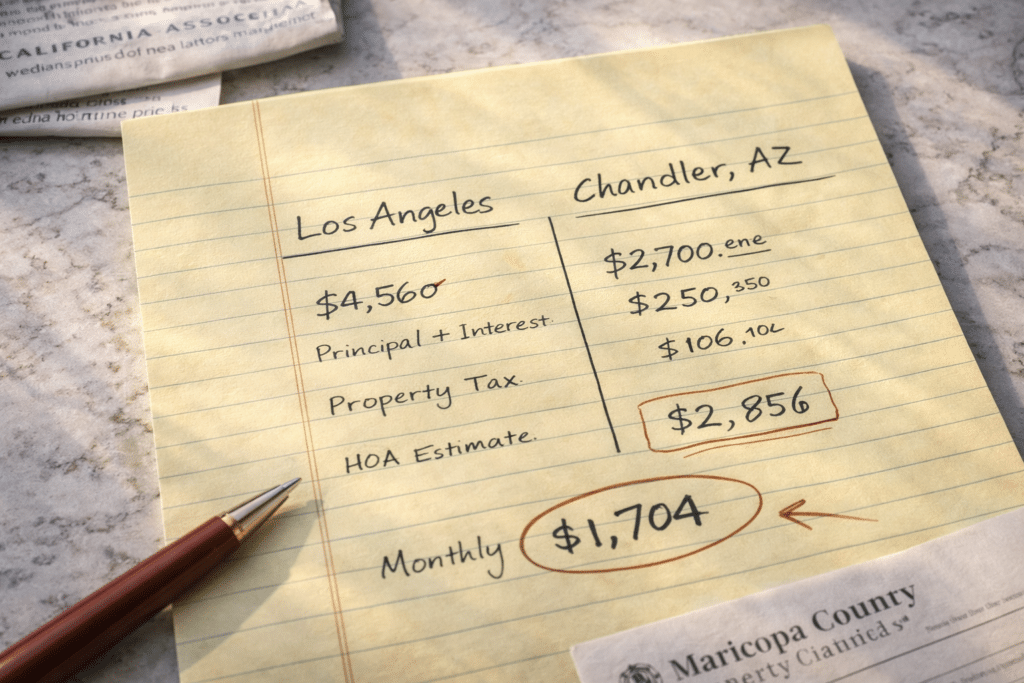
At a 6.5% 30-year fixed rate with 20% down, estimated principal-and-interest (P&I) on a $565,000 Chandler home is approximately $2,856/month. Add Maricopa property tax (~$245/month) and HOA dues (often ~$50–$150/month in HOA communities), and a median-tier Chandler housing cost commonly models around ~$3,150–$3,250/month.
A Bay Area seller’s ~$3,206/month mortgage delta is ~$38,472/year in reduced mortgage obligation before income tax savings. A San Jose seller purchasing at the Chandler median often sees a combined first-year improvement on the order of ~$48,000–$52,000 when P&I delta and state income tax delta are combined (ranges vary by income and deductions).
Estimated monthly mortgage payment reduction for California sellers purchasing at the Chandler 2025 median, by origin market
| Origin Market | CA Median | CA Monthly P&I (6.5%, 20% down) | Chandler Monthly P&I | Monthly Delta |
|---|---|---|---|---|
| Los Angeles County | $890,910 | ~$4,501 | ~$2,856 | ~$1,645/mo |
| San Diego County | ~$950,000 | ~$4,799 | ~$2,856 | ~$1,943/mo |
| SF / Bay Area | ~$1,200,000 | ~$6,062 | ~$2,856 | ~$3,206/mo |
| San Jose / Silicon Valley | ~$1,500,000 | ~$7,577 | ~$2,856 | ~$4,721/mo |
Sources: C.A.R. (Dec 2025); FlexMLS/MLS (Chandler, 2025). Mortgage math uses 6.5% 30-year fixed, 20% down, principal and interest only.
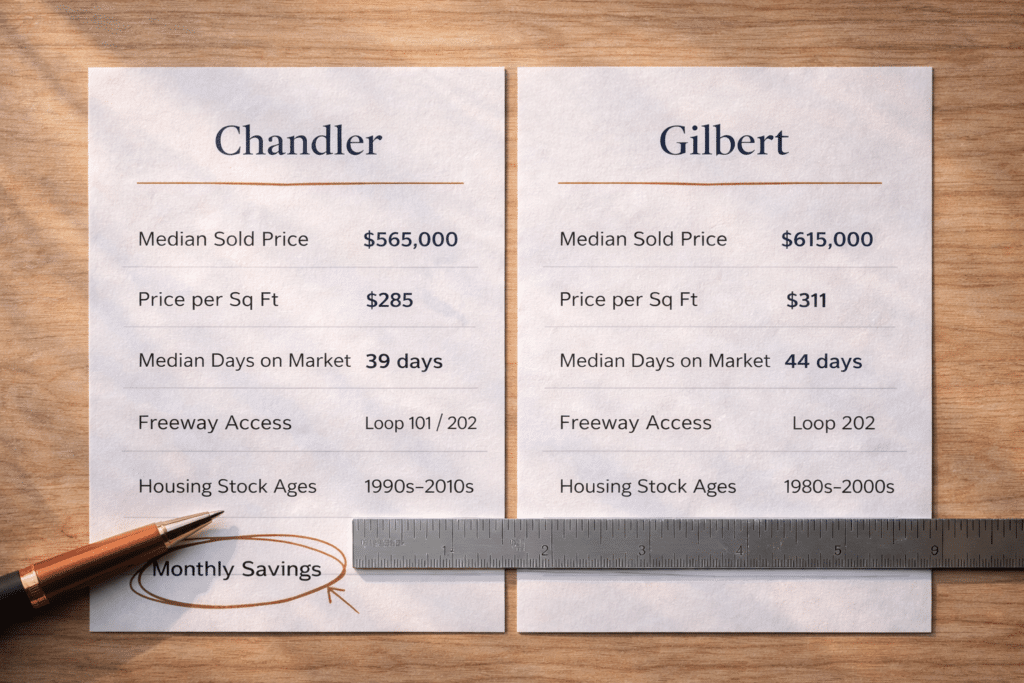
Chandler and Gilbert are commonly compared because both deliver East Valley master-planned inventory, HOA infrastructure, similar lot sizes, and overlapping price bands. Differences are most visible in median price, price-per-square-foot, housing stock mix, and freeway/employment corridor positioning.
The ~$27,250 median gap (Chandler lower) reflects an older average housing stock and a larger mix of attached product pulling the overall median down. Comparing like-for-like product (detached single-family, 2,200+ sq ft, 3-car garage) narrows the spread materially.
| Metric | Chandler | Gilbert |
|---|---|---|
| 2025 Median Sold Price | $565,000 | $592,250 |
| Price per Sq Ft | ~$287–$297 | ~$269–$280 |
| Median Days on Market | ~55–62 days | ~62–64 days |
| Primary Employment Proximity | Price Road / Intel corridor | Loop 202 / SanTan corridor |
| Housing Stock Age (dominant) | 1990–2015 resale + new build | 2000s resale + active new |
| New Construction Availability | Moderate (SE Chandler) | Higher (SE / East Gilbert) |
| HOA Infrastructure | Pools, parks, ramadas, trails | Pools, parks, ramadas, trails |
| Freeway Access | Loop 101, Loop 202, I-10 | Loop 202, US-60 |
Sources: FlexMLS/MLS (2025); ARMLS (2025); commonly cited municipal assessment references.