Mesa, Arizona is the Phoenix metro’s value-access destination for Inland Empire homeowners who want maximum square footage per dollar, broad inventory across multiple price bands, and a proven east Valley employment base — all at a median sold price approximately $145,000 below Riverside County and $92,000 below Gilbert. At approximately $256–$261 per square foot — lower than any other east Valley city in this silo — Mesa converts Inland Empire equity into the largest immediate cost differential available in the Phoenix Valley.
Inland Empire buyers evaluating the Phoenix east Valley will encounter two primary destinations in this silo — Mesa and Gilbert. They are not interchangeable. They represent distinct financial theses, and choosing between them depends on where a buyer’s equity sits and what they are optimizing for.
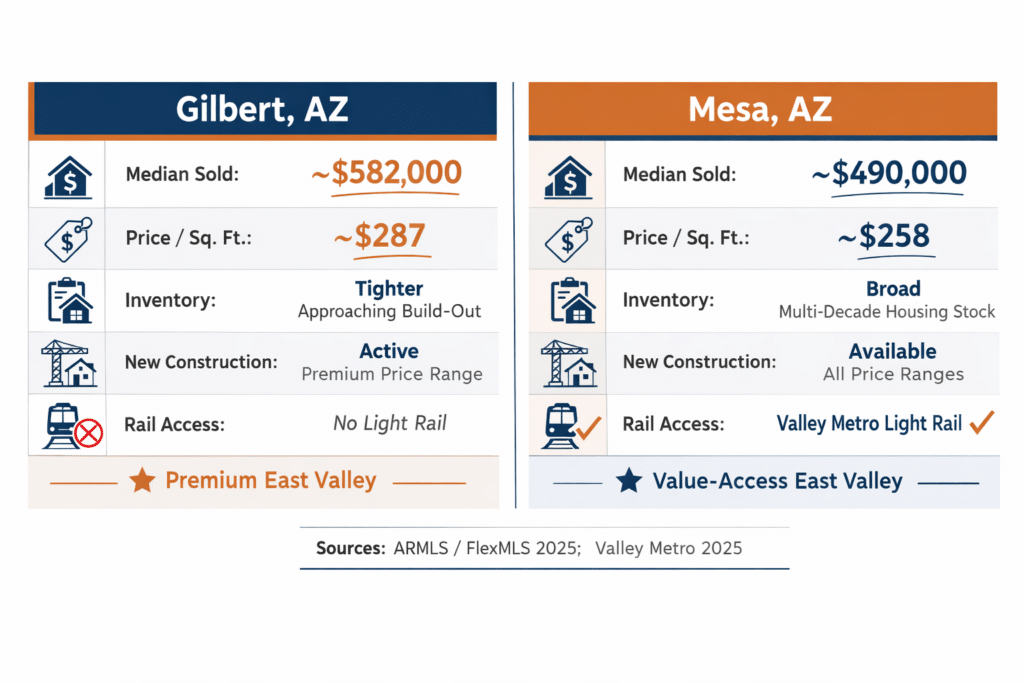
GILBERT: Median ~$582K, avg. ~$287/sqft. Premium east Valley destination with master-planned luxury communities, approaching build-out, upper-income employment cluster, and a tighter resale inventory. Best suited for Riverside County sellers who want new-construction proximity, premium finishes at the $600K+ range, or who are trading up significantly from their IE purchase price.
MESA: Median ~$490K, avg. ~$256–$261/sqft. Arizona’s third-largest city with more than 520,000 residents, an established and diverse housing inventory across price bands from $350K to $700K+, Valley Metro light rail connectivity to Tempe and Phoenix, and the lowest price-per-square-foot of any east Valley destination in this silo. Best suited for buyers who prioritize maximum space per dollar, broader negotiating leverage, or employment access via rail rather than freeway.
Neither destination is superior in absolute terms. The right answer depends on a buyer’s specific equity position, income level, employment geography, and target floor plan. For IE buyers whose primary financial objective is minimizing purchase price and maximizing square footage, Mesa delivers the strongest argument in the Phoenix east Valley.
NOTE ON BOTH CARDS: All calculations are estimates for planning purposes. Purchase price, mortgage rate, down payment, property tax jurisdiction, and income vary by individual situation. Consult a licensed real estate professional and a qualified tax professional for situation-specific figures. Sources: CAR Nov 2025; ARMLS / FlexMLS 2025; Maricopa County Treasurer FY2024; Tax Foundation 2025; Census ACS 2023.
Mesa’s structural price-per-square-foot advantage over both IE counties is the most significant in the east Valley. At approximately $256–$261 per square foot — based on ARMLS data tracked through 2025 — Mesa delivers more living space per dollar than Gilbert (~$287), Chandler (~$285), or Scottsdale (~$370+).
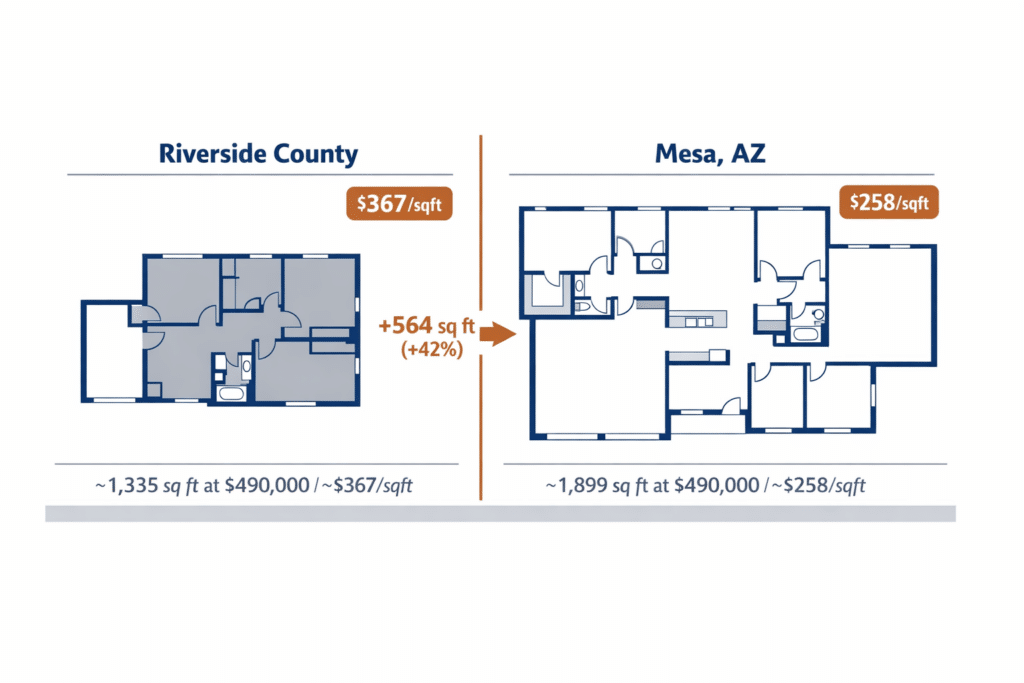
For a Riverside County homeowner budgeting $490,000, the square footage comparison is stark:
| Market | Price / Sq. Ft. | At $490,000 Budget |
|---|---|---|
| Riverside County, CA | ~$367/sqft | ~1,335 sq ft |
| San Bernardino County, CA | ~$334/sqft | ~1,467 sq ft |
| Mesa, AZ | ~$258/sqft | ~1,899 sq ft |
| Mesa vs. Riverside | +$109/sqft more in CA | +564 sq ft in AZ (+42%) |
| Mesa vs. SB County | +$76/sqft more in CA | +432 sq ft in AZ (+29%) |
Sources: ARMLS (via metrophoenixhomes.com citing ARMLS, 2025); CAR /regional MLS, late 2025 (Riverside County, San Bernardino County).
In practical floor plan terms: an IE homeowner selling a 1,700 square foot California home and budgeting $490,000 in Mesa can purchase a home of approximately 1,900 square feet — gaining a bedroom, a dedicated home office, or a formal dining room with no increase in purchase budget. Three-car garages are available in Mesa across the $450,000–$600,000 price range in a way that is structurally unavailable in the IE at equivalent price points.
Mesa’s price/sqft advantage relative to Gilbert (~$258 vs. ~$287) means that buyers who are focused on space — rather than new-construction proximity or premium finish levels — consistently find Mesa the stronger value among east Valley options. The tradeoff is that Mesa’s inventory is primarily resale and mid-cycle construction rather than the master-planned new-build communities still delivering in Gilbert’s southeast.
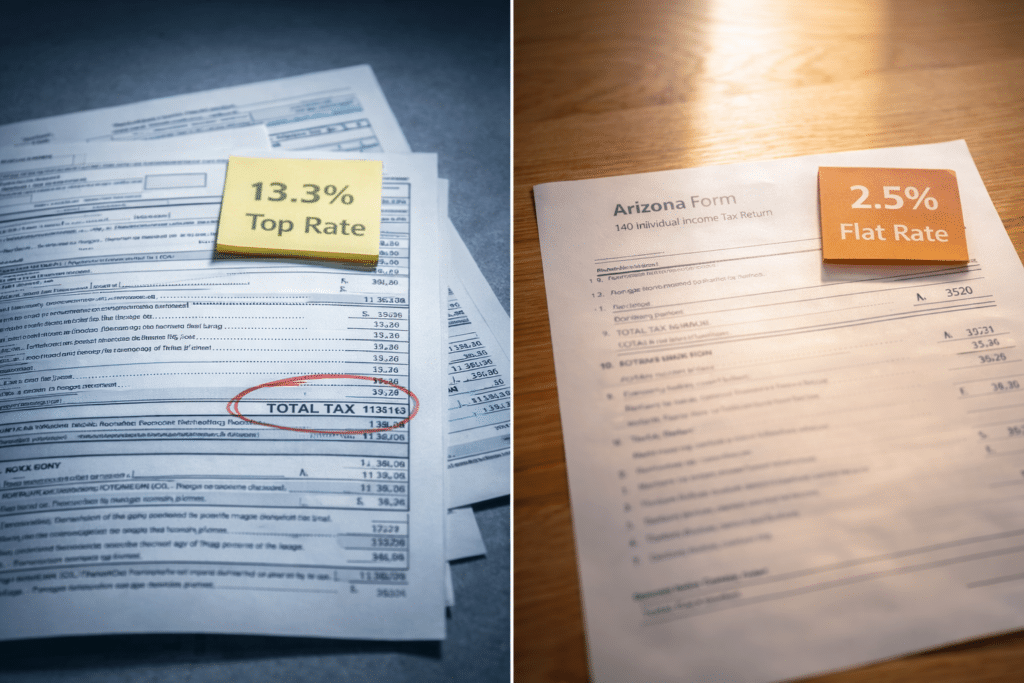
Arizona’s income tax advantage over California is a function of state residency, not the specific city a buyer chooses within Arizona. Whether a buyer purchases in Mesa, Gilbert, Surprise, or any other Maricopa County community, the tax differential is identical: California’s graduated rate (13.3% top marginal, Tax Foundation 2025) versus Arizona’s flat 2.5%.
For Mesa buyers at the city’s median household income of approximately $82,752 (Census ACS 2023):
Note: CA estimate based on 2025 Tax Foundation brackets, approximate standard deduction for married filing jointly. AZ estimate at 2.5% flat on approximate taxable income. For planning purposes only. Sources: Tax Foundation, 2025; Census ACS 2023 (Mesa median income).
Riverside County buyers who bring higher household incomes — at or above their county median of ~$93,172 — will see proportionally larger savings. At $93,172, the annual Arizona income tax savings rises to approximately $5,000–$7,000 annually depending on filing status and deductions.
Source: Tax Foundation, 2025
Tax Foundation, 2025
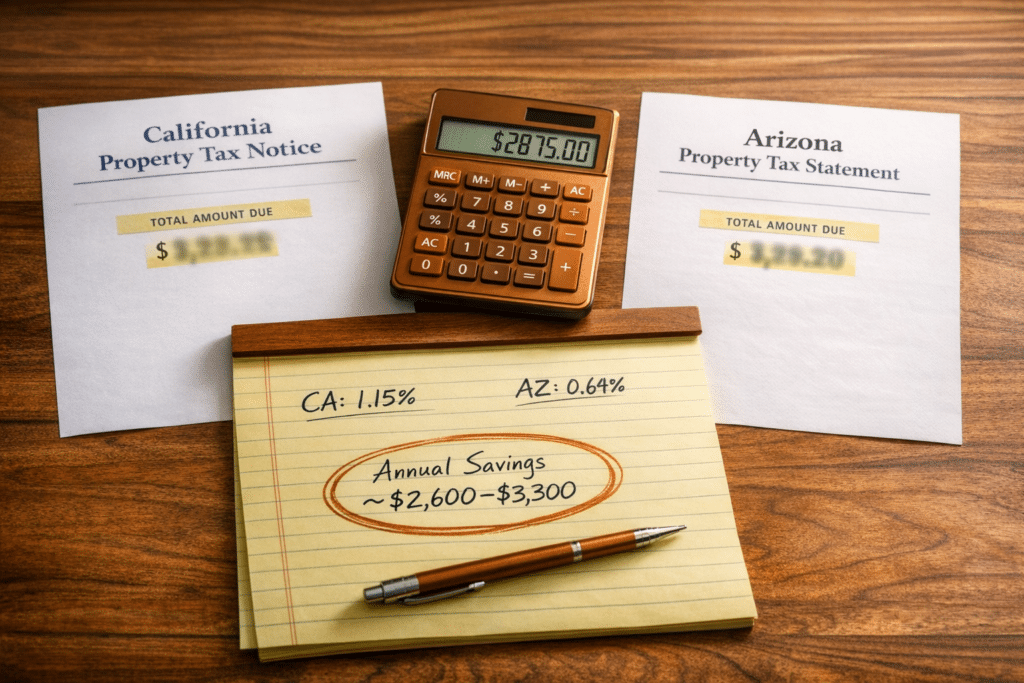
Like Gilbert, Mesa is located entirely within Maricopa County and carries the same effective residential property tax rate structure — approximately 0.52%–0.64% effective rate (Maricopa County Treasurer FY2024 Popular Annual Financial Report; Ownwell, citing Maricopa County data).
Because Mesa’s median purchase price (~$490,000) is materially lower than Gilbert’s (~$582,000), the actual annual property tax dollar bill is proportionally lower for a Mesa buyer — even at the same effective rate.
| Market | Eff. Rate | Annual Bill (Est.) |
Monthly Cost (Est.) |
|---|---|---|---|
| Riverside Co., CA | ~1.10–1.20% | ~$5,390–$5,880 | ~$449–$490 |
| San Bernardino Co., CA | ~1.15–1.20% | ~$5,635–$5,880 | ~$470–$490 |
| Mesa, AZ (Maricopa) | ~0.52–0.64% | ~$2,548–$3,136 | ~$212–$261 |
| Annual savings vs. IE | ~$2,254–$3,332 | ~$188–$278/mo |
Sources: Maricopa County Treasurer, FY2024 PAFR; Ownwell (citing Maricopa County Treasurer data); Tax Foundation; Victor Valley Times / BlockShopper Q4 2024 (IE effective rate reference). Estimates. Actual bills depend on special district levies, exemptions, and assessed value.
Note on Proposition 13: IE buyers currently benefit from Proposition 13’s assessed value limitations on their existing California home. This protection ends the moment they sell — whether they rebuy in California or relocate to Arizona. The comparison above reflects the effective rate on a new purchase, which is the relevant metric for any buyer making a move decision.
Source: ARMLS / FlexMLS, 2025 YTD
Source: ARMLS, 2025
Source: ARMLS / FlexMLS, 2025
Source: Maricopa County Treasurer, FY2024
Z Dept. of Revenue; City of Mesa, 2025
Source: U.S. Census Bureau, 2024 PEP
Mesa is Arizona’s third-largest city and the largest municipality in Maricopa County by land area (approximately 138 square miles). Its size produces a market dynamic that differs fundamentally from Gilbert’s: Mesa has substantially more resale inventory at any given time across a broader price spectrum, from $350,000 to $800,000+. For IE buyers who want negotiating leverage, more property options per search, and time to evaluate without the compressed timelines of a tighter inventory market, Mesa’s scale is a structural advantage.
Days on market at 60–70 days reflects a buyer-favorable environment through late 2025, with inventory meaningfully elevated vs. the 2021–2023 period. Sellers in Mesa are accepting offers below list price in many cases — a negotiating condition largely absent in Mesa’s market two years prior.
Mesa’s sales tax rate of 8.3% combines Arizona’s 5.6% state rate, Maricopa County’s 0.7%, and Mesa’s 2.0% city rate (Arizona Department of Revenue, Transaction Privilege Tax Rate Table, 2025). This is identical to Gilbert’s 8.3% combined rate and modestly below Phoenix proper’s 8.6%.
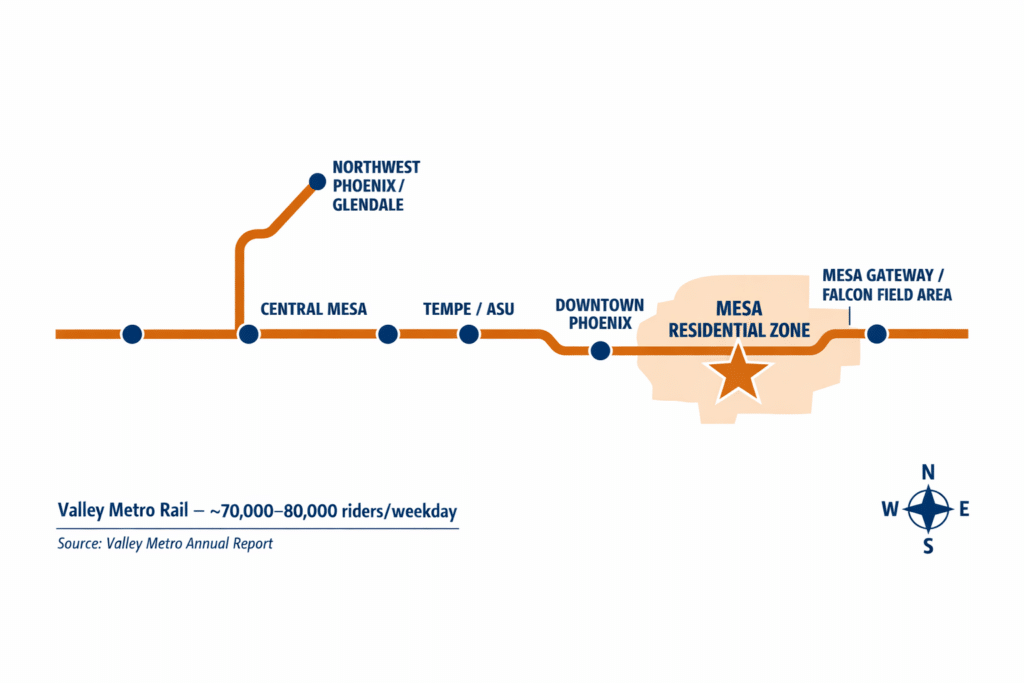
Mesa is the only Inland Empire silo destination page in this series with direct Valley Metro light rail service. For IE buyers whose household income comes from Phoenix-based, Tempe-based, or Arizona State University- adjacent employment — or who work remotely but want transit optionality — this distinction is financially and practically relevant.
Valley Metro Rail currently serves central and western Mesa through a main line that runs westward through Tempe and into downtown Phoenix, connecting to the broader regional rail network serving Glendale, the convention district, and northwest Phoenix. The system carries approximately 70,000–80,000 riders per weekday (Valley Metro annual ridership data). Mesa Gateway Extension stations, added in recent years, expanded rail access further east within Mesa.
For a Mesa homeowner employed along the rail corridor, a rail commute eliminates one vehicle’s operating costs — typically $8,000–$12,000 per year in depreciation, fuel, insurance, and maintenance (Bureau of Labor Statistics, Consumer Expenditure Survey, 2024) — in addition to all other Mesa cost advantages. For households making a two-income relocation decision with one partner working downtown Phoenix, rail access can eliminate the need for a second vehicle entirely during weekday hours.
Gilbert does not have light rail service. The West Valley destinations in this silo also do not have light rail. Mesa is unique in the IE destination page series for this infrastructure characteristic.
Valley Metro Rail connects central and western Mesa to downtown Phoenix via Tempe. Commute time approximately 30–45 minutes city center to city center.
Arizona State University’s main Tempe campus is along the rail line, making Mesa a logical residential base for university-adjacent employment or continuing education.
Falcon Field Airport serves general aviation and supports aerospace and manufacturing employment in northeast Mesa — a freeway-access employment node distinct from the light rail corridor.
Freeway-based commuters use the Superstition Freeway (US 60) and Loop 202 for access to Chandler, Gilbert, Scottsdale, and Phoenix employment corridors not served by rail.
With approximately 517,000–520,000 residents across 138 square miles, Mesa’s housing stock is the most diverse of any east Valley destination in this silo by volume, age, and price band. This depth has immediate financial implications for buyers:
PRICE BAND BREADTH: Mesa’s active resale inventory spans from the $350,000 range (smaller post-war footprints in western Mesa) through the $700,000+ range (newer construction in northeast and east Mesa, Red Mountain area). A Riverside County seller with $200,000+ in equity has legitimate options at multiple price points — not a single compressed target band.
NEGOTIATING LEVERAGE: With days on market at 60–70 days and inventory elevated relative to the 2021–2024 period, Mesa sellers are accepting concessions — both price concessions and seller credits toward closing costs and mortgage rate buydowns — more frequently than in prior years. This is directly quantifiable: sellers in Mesa accepted an average of approximately $8,400 below list price in June 2025 (ARMLS data via metrophoenixhomes.com). For a buyer, that is real transactional value.
GEOGRAPHIC DIVERSITY: Eastern Mesa (closer to Gilbert, newer construction, larger lots) offers a different housing profile than central Mesa (established neighborhoods, larger lot sizes relative to price, proximity to rail) or western Mesa (higher density, lower price-per-unit). IE buyers can self- select into the Mesa sub-market that fits their employment geography, floor plan preference, and budget.

Source: U.S. Census Bureau
Source: U.S. Census Bureau, 2024 PEP
For Riverside County homeowners, Mesa produces the largest combined annual savings of any Phoenix Valley destination in the IE silo — driven primarily by the $145,000 purchase price differential and its downstream effects on monthly mortgage obligation.
| Category | Est. Annual Savings in Mesa |
|---|---|
|
Monthly P&I differential
(Riverside $635K vs. Mesa $490K, 20% down, 6.5% 30-yr fixed)
|
~$8,808/year (~$734/month) |
|
State Income Tax (CA vs. AZ)
on ~$93,172 annual income
|
~$5,000–$7,000/year (Tax Foundation, 2025; Census ACS 2024) |
|
Property Tax
(IE 1.15% on $635K vs. AZ 0.64% on $490K)
|
~$4,167/year |
|
Price-per-sqft arbitrage
(not a dollar savings — a space dividend)
|
+564 sq ft at the same budget vs. Riverside County |
| Sales Tax | Broadly comparable (8.75%+ in SB County cities vs. 8.3% Mesa) |
| COMBINED ESTIMATED ANNUAL SAVINGS (P&I + Income Tax + Property Tax) |
~$17,975–$19,975/year |
The ten-year cumulative value at the low end of these estimates: approximately $179,750 in retained household capital — before any consideration of Arizona equity appreciation on the purchased asset or Mesa’s buyer-favorable negotiating conditions at time of purchase.
For San Bernardino County buyers, the combined picture at the Mesa median is: ~$10,370–$11,970/year in combined savings (P&I + property tax + income tax), payback on any incremental purchase costs in under 12 months, and 432 additional square feet of living space at the same budget.