California’s statewide median home price hit $873,900 in 2025. The Greater Phoenix median is $450,000. That gap isn’t just a price difference — it’s a wealth-preservation strategy that 57,857 Californians acted on in a single year.
Every year, California leads the nation in domestic outmigration. Between 2023 and 2024 alone, the state posted a net domestic migration loss of 254,332 residents, according to Census Bureau population estimates. Arizona ranked fourth nationally in net domestic migration gains during the same period, behind only Texas, North Carolina, and South Carolina.
The driving force isn’t complicated — it’s arithmetic. A household selling a median-priced California home and purchasing at the Greater Phoenix median stands to free up roughly $400,000 or more in equity. That delta buys a larger home, a lower cost basis, and a fundamentally different tax landscape.
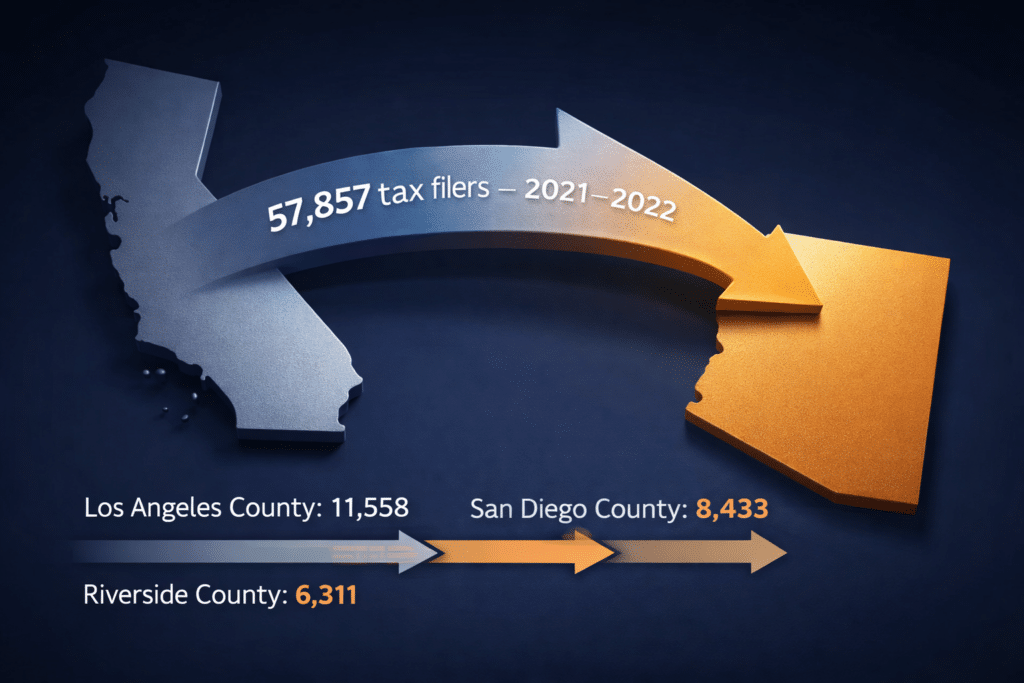
This is why IRS data consistently show California as the single largest contributor of new Arizona residents: 57,857 tax filers moved from California to Arizona in the 2021–2022 filing year, more than double the next-closest origin state.
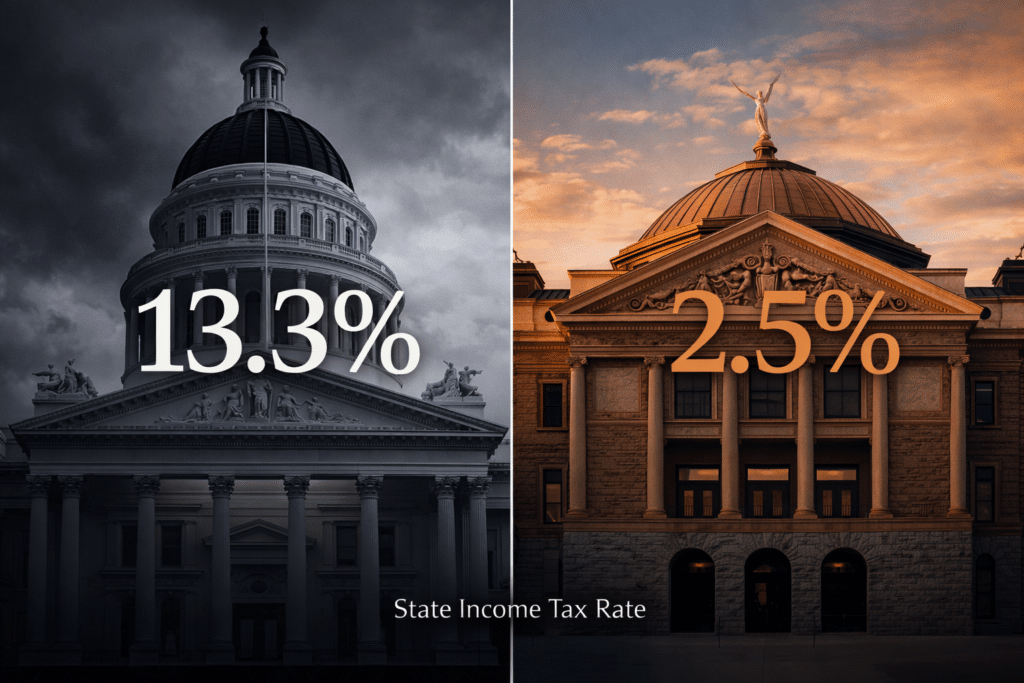
But the arbitrage isn’t just about the sale price. California’s income tax structure tops out at 13.3% — the highest in the nation — with an additional 1.1% payroll surcharge for high earners. Arizona charges a flat 2.5% on all income. For a household earning $200,000, that’s a difference of roughly $15,000 to $20,000 per year in state income tax alone, before factoring in property tax savings, lower insurance premiums, and reduced day-to-day costs.
The numbers paint a clear picture: this is a financial migration, driven by homeowners who have built significant equity and want to convert it into a materially better position. If that describes you, you’re in the right place. This guide breaks down exactly how the math works, where in the Valley your California equity stretches furthest, and what the tax implications look like at the household level.

Taxes are the single most overlooked variable in relocation math. Most Californians know their state income tax is high, but few realize how much the gap compounds when you account for property tax rates on higher-valued homes, capital gains exposure on a home sale, and the baseline sales tax differential.
The income tax gap is the headline, but property tax math matters more than most people realize. California’s Proposition 13 caps assessed value increases, which benefits long-term owners — but the moment you sell that home, you exit the Prop 13 umbrella. Your next property will be assessed at full purchase price. In Maricopa County, where the effective rate runs about 0.52%, a $500,000 home generates an annual property tax bill of roughly $2,600. The same assessed value in Los Angeles County would yield closer to $3,650 to $4,000 depending on the taxing district.
| Tax Category | California | Arizona |
|---|---|---|
| Top State Income Tax Rate | 13.3% (+ 1.1% surcharge) | 2.5% flat |
| Effective Property Tax Rate | ~0.73% | ~0.52% (Maricopa Co.) |
| Avg Combined Sales Tax | 8.82% | 8.40% |
| Estate / Inheritance Tax | None | None |
| Social Security Tax | Not taxed at state level | Not taxed at state level |
Sources: Tax Foundation, 2025 State Income Tax Rates; Maricopa County Treasurer; California Franchise Tax Board
Tax savings get the attention, but the day-to-day cost reductions are what California transplants notice first. According to BLS Consumer Expenditure data, the Phoenix metro’s overall cost of living runs roughly 3% to 6% above the national average, depending on the specific municipality. Compare that to the San Francisco Bay Area at 80%+ above average, or Los Angeles at 40%+ above average, and the recalibration is significant.
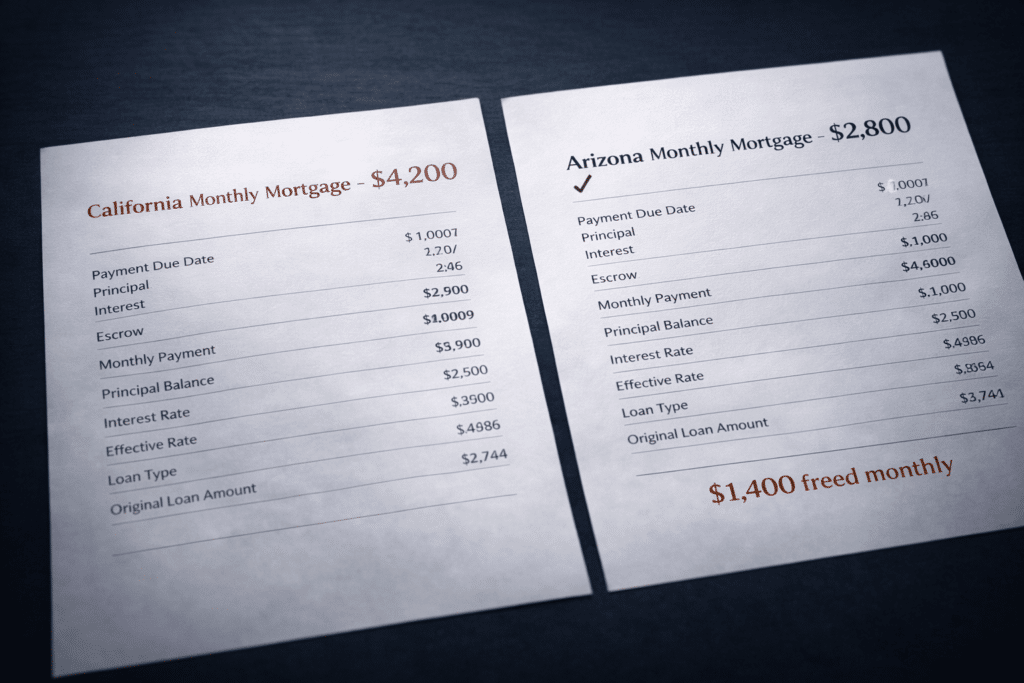
Housing is the dominant variable. A household currently paying $4,200 per month on a California mortgage (the approximate payment on an $850,000 home at 6.5% with 20% down) could carry a comparable or larger home in Gilbert or Chandler at roughly $2,600 to $3,000 per month — freeing up $1,200 to $1,600 in monthly cash flow. Over a decade, that reallocation compounds into six figures of additional savings, investment capital, or accelerated mortgage payoff.
Auto insurance, groceries, and utilities (outside of summer electric bills) all trend lower than their California counterparts. One category where Arizona is not cheaper: summer cooling costs. Expect electric bills of $250 to $400 per month from June through September in a typical single-family home. Factor that in — but also factor in that you’re no longer paying California’s tiered electricity rates, which rank among the highest in the nation.
The Valley is not monolithic. Where your equity goes furthest depends on what you’re optimizing for: square footage, lot size, proximity to specific corridors, or walkable urban access.
The pattern is consistent: California equity in the $800K to $1.2M range can secure a comparable or larger home in most Valley communities with substantial cash remaining. A household selling a $1.1M home in San Jose, for example, could purchase a 2,800-square-foot home on a quarter-acre lot in Gilbert for $600,000 and retain approximately $380,000 to $420,000 in net equity after transaction costs.

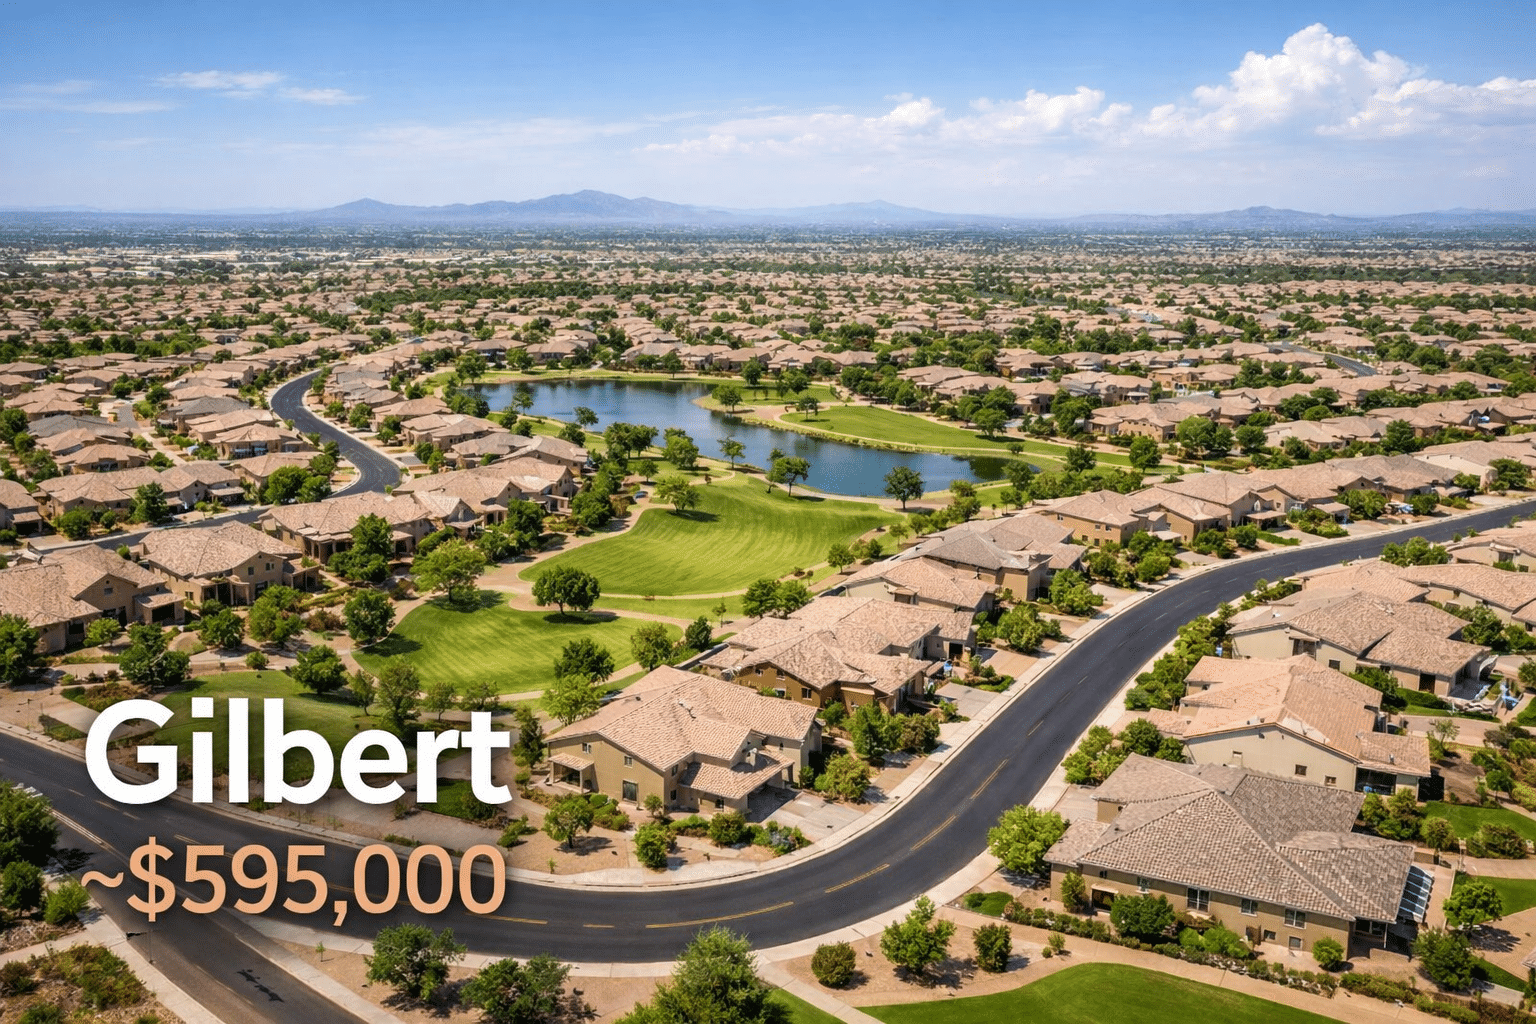
Median: ~$595,000 (2025 YTD)
Master-planned communities, top-rated school districts, strong HOA infrastructure.

Median: ~$540,000
Tech corridor proximity, established neighborhoods, mixed retail.

Median: ~$1,180,000 (2025 YTD)
Premium positioning — the Valley's closest analog to coastal CA living.
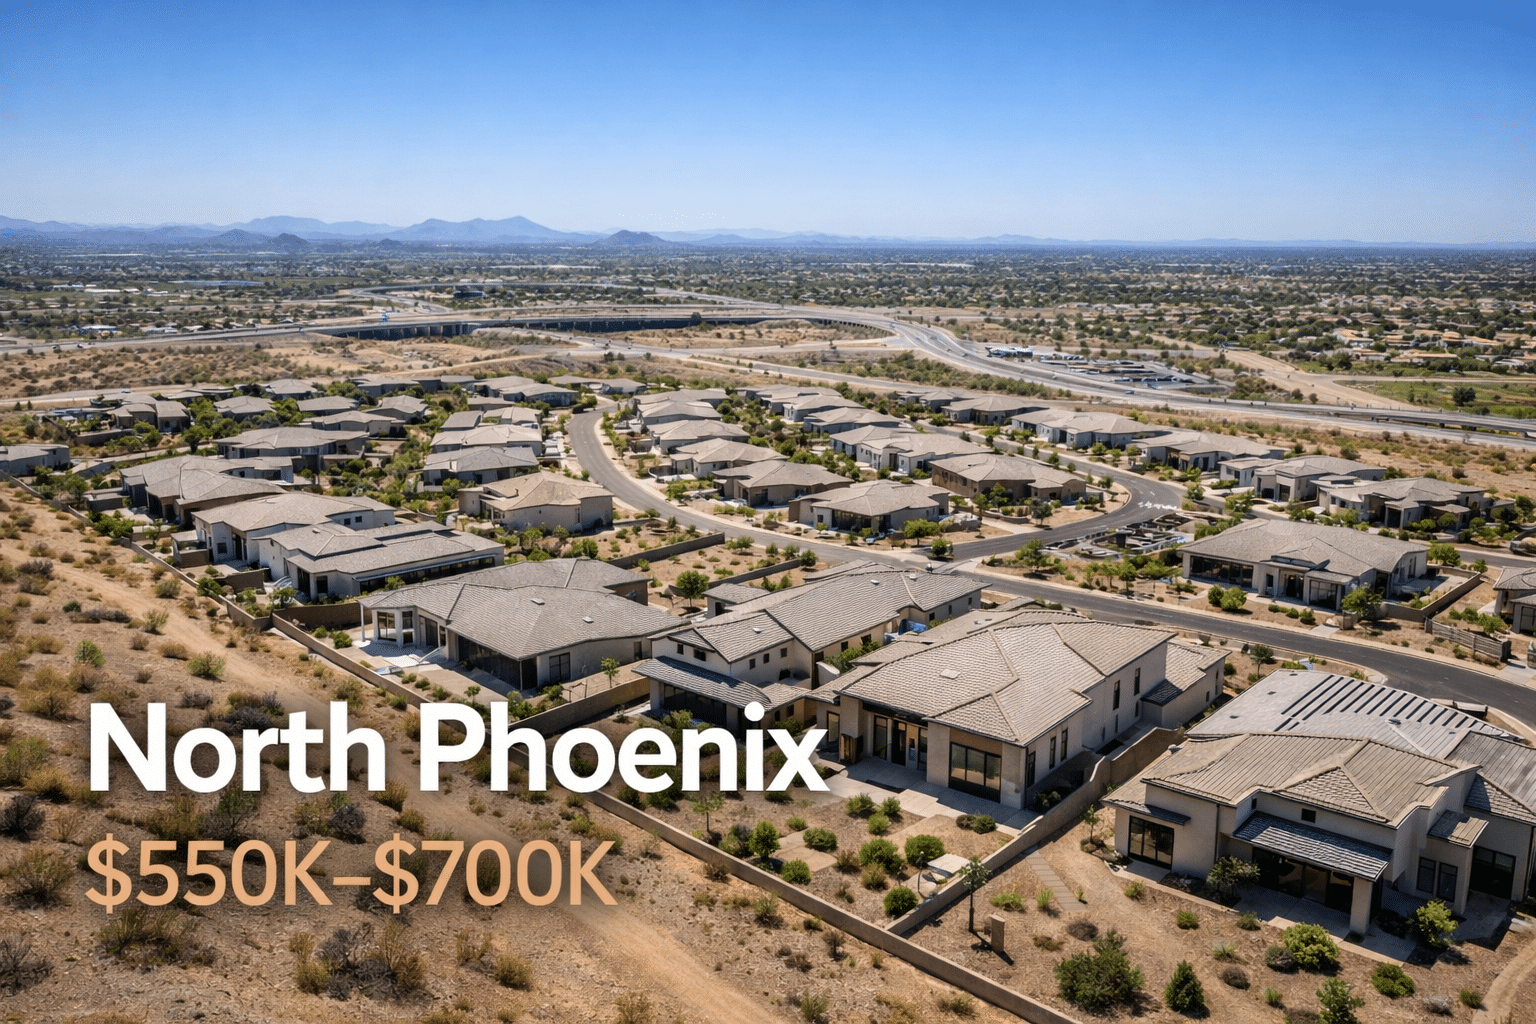
Range: ~$550,000–$700,000
Newer builds, master-planned, proximity to the Loop 101 and Loop 51 corridors.
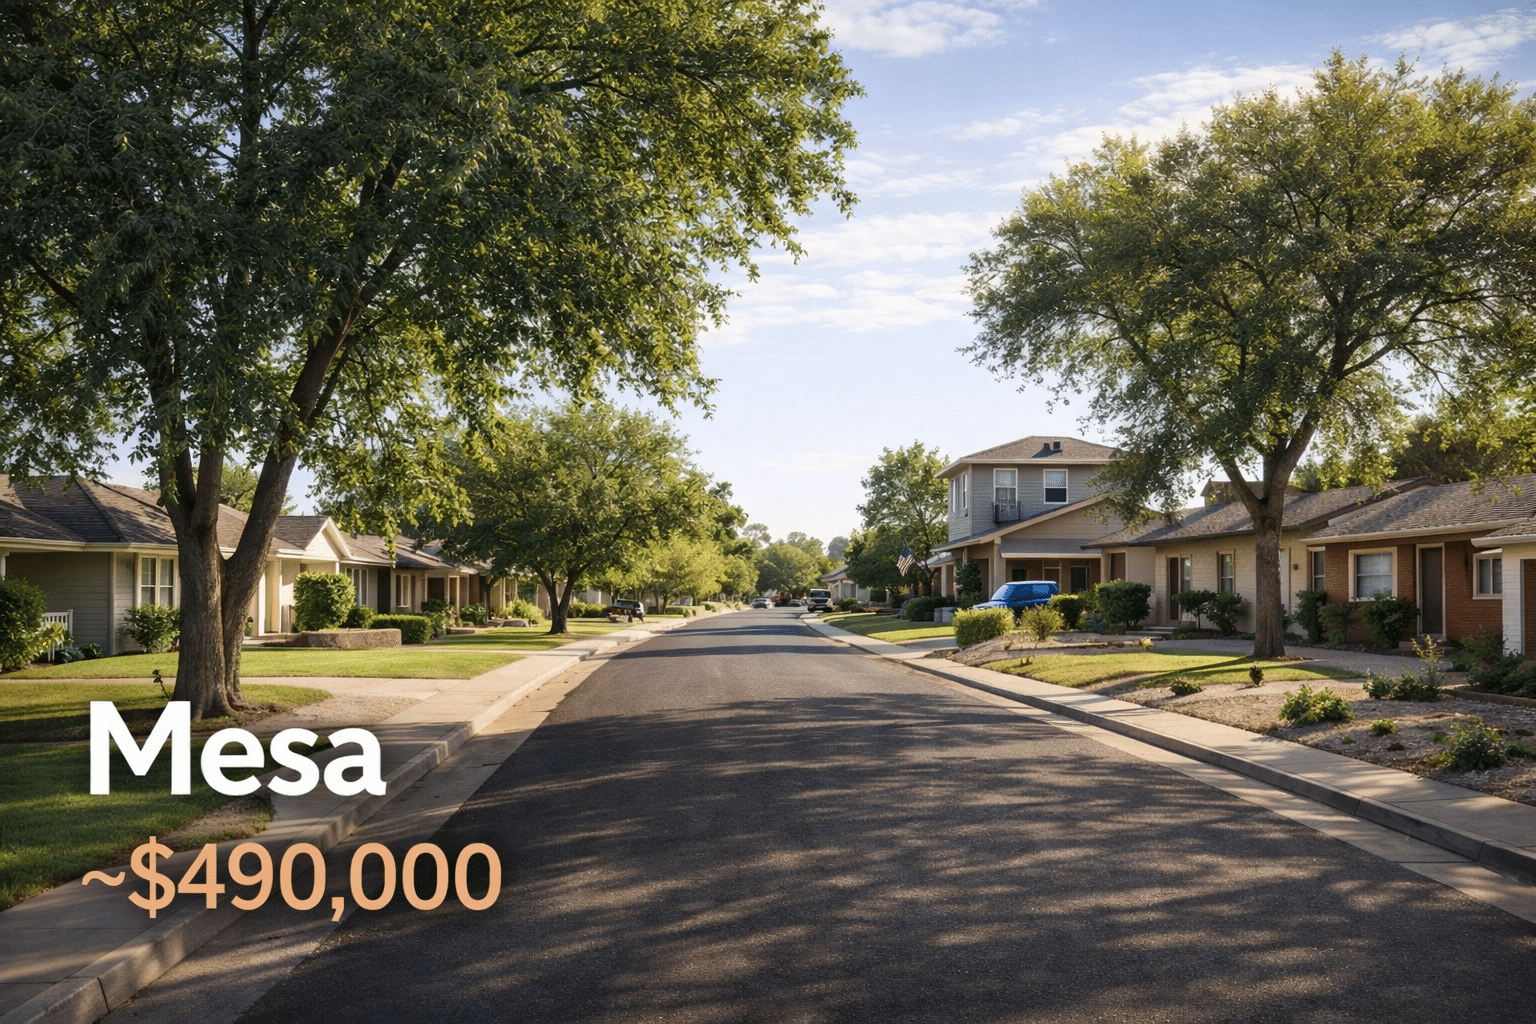
Median: ~$490,000 (2025)
Broad inventory range from entry-level to established neighborhoods.
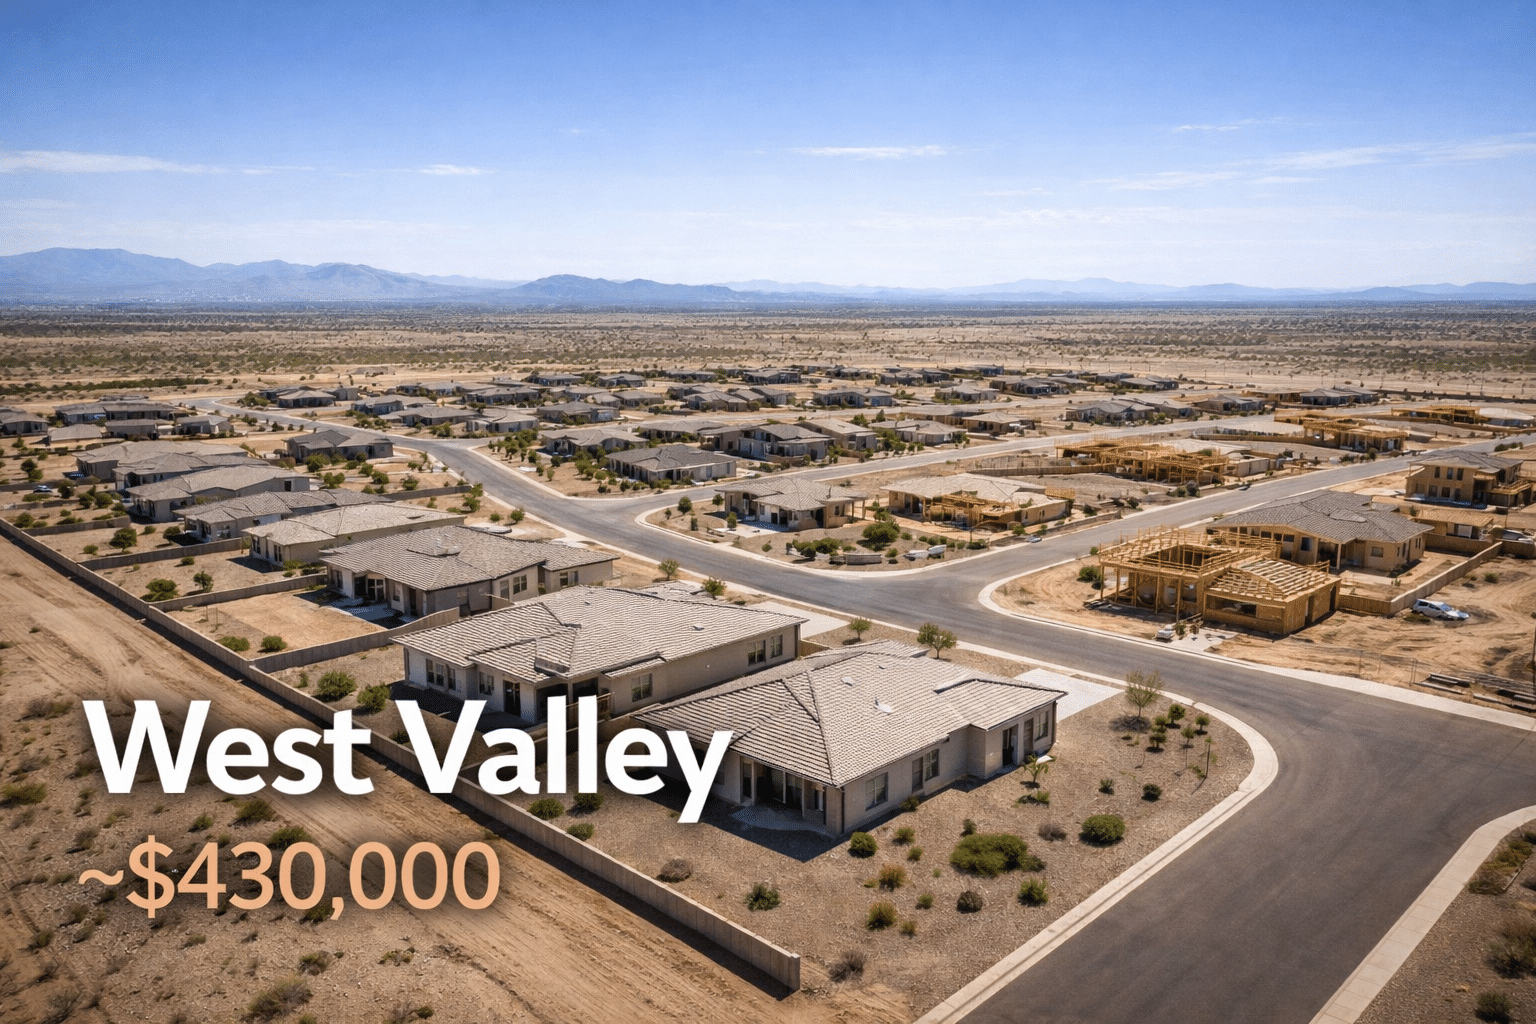
Median: ~$430,000
Maximum square footage per dollar. Newer inventory, rapid infrastructure build-out.
Price data: ARMLS, Phoenix REALTORS year-to-date 2025 reports. Scottsdale figure reflects first 10 months of 2025.
Every California market has its own median price, tax profile, and cost structure. A household leaving San Francisco faces a different equity equation than one leaving the Inland Empire.
LA County sent 11,558 residents to Arizona in 2022 — the single largest county-to-state migration corridor in the IRS data. With a county median well above $800,000, Los Angeles sellers bring substantial equity into the Valley
Bay Area home values remain among the highest in the nation, with median prices in San Francisco proper exceeding $1.2M. The equity gap between the Bay and the Valley is enormous — and the income tax differential is the steepest of any origin market.
Silicon Valley medians routinely exceed $1.4M for single-family homes. Even a modest San Jose home sale can fund a premium Scottsdale property with six figures left over.
San Diego County contributed 8,433 migrants to Arizona in 2022, per IRS data — the second-largest California county source. The climate transition is minimal; the financial transition is dramatic.
This isn’t a trickle — it’s a structural shift. According to Census Bureau population estimates released in December 2024, California posted a net domestic migration loss of 239,575 residents between 2023 and 2024. Arizona, meanwhile, gained 109,357 total residents in the same period, ranking among the top five states for population growth nationally.
A notable trend within the IRS data: migration in the $100,000–$200,000 income bracket is accelerating faster than lower-income brackets. These are homeowners with equity — exactly the profile this guide is designed for.
| California County | Migrants to AZ | Net Flow (AZ Gain) |
|---|---|---|
| Los Angeles County | 11,558 | +7,092 |
| San Diego County | 8,433 | +4,099 |
| Riverside County | 6,311 | +3,800+ |
Source: IRS Statistics of Income, County-to-County Migration Data, 2021–2022