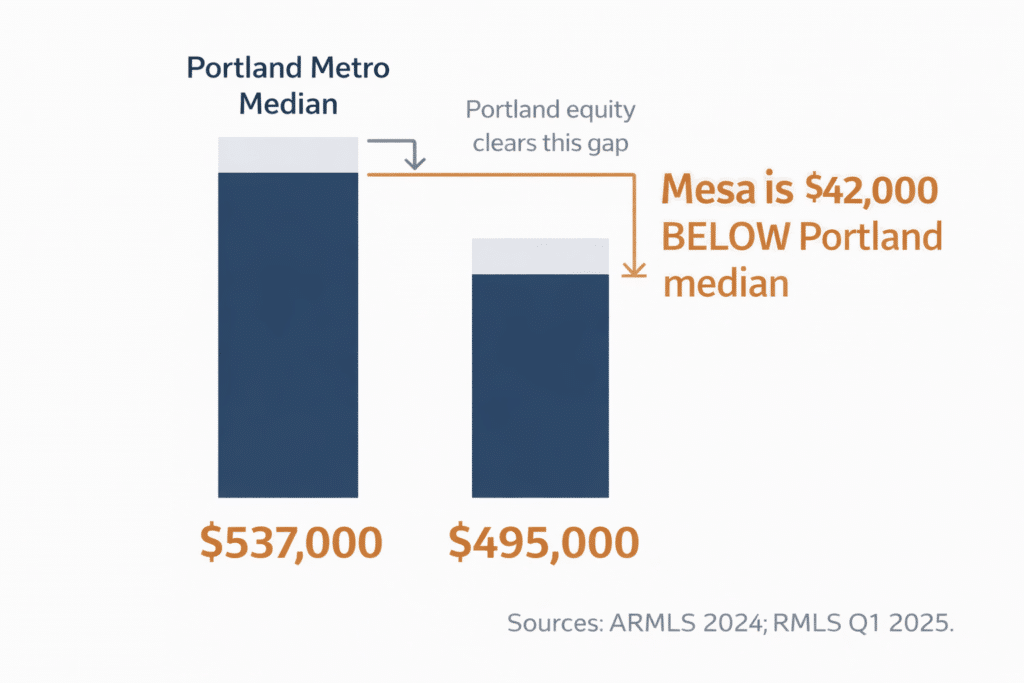
Mesa’s 2024 full-year median sold price of $495,000 is the only East Valley destination on this site that sits below Portland’s metro median of approximately $537,000. For Portland homeowners with equity, this inversion means something specific: your proceeds don’t need to reach up to Mesa’s median. They already clear it — and leave room. This page runs the numbers on what that equity surplus means for your purchase capacity, your monthly carrying cost, and your first-year tax position in Arizona.
Every other destination guide in the Portland silo describes a market where the destination median is higher than Portland’s — where Portland equity closes a gap. Mesa inverts that dynamic.
Portland metro median sold price: approximately $537,000 (RMLS, Q1 2025). Mesa 2024 full-year median sold price: $495,000 (ARMLS). Difference: Mesa is approximately $42,000 below Portland’s median.
This inversion has a direct consequence for how Portland equity holders approach the Mesa market. A Portland homeowner selling at the metro median of $537,000 with standard equity — 10 to 20 years of mortgage payments plus appreciation — arrives in Mesa with net proceeds well above the $99,000 needed for a 20% down payment at Mesa’s $495,000 median. They are not using equity to stretch. They are using equity to position — at the median, above it, or to reduce their financed balance and lower their monthly carrying cost.
That positioning optionality is the financial advantage Mesa offers that the other three Portland destinations do not. Scottsdale requires above-median Portland equity to access a below-median Scottsdale purchase. Gilbert and Chandler are close enough to Portland’s median that entry requires most of the standard equity position. Mesa is the market where Portland equity surplus is the starting condition.
For Portland sellers with larger equity positions — $150,000 to $300,000 in net proceeds — Mesa’s $700,000–$1,250,000 tier delivers approximately 2,500–4,600 square feet at the 2024 average of approximately $270–$275 per square foot, in communities that span East Mesa, Southeast Mesa, and the Red Mountain corridor.
Mesa 2024 median ($495K) is $42,000 below Portland metro median (~$537K) — the only negative median gap in the Portland silo
SOURCE: ARMLS 2024 annual data; RMLS Q1 2025
Minimum 20% down payment at Mesa’s 2024 median — the lowest equity threshold of any East Valley destination guide on this site
SOURCE: 20% × $495,000; ARMLS 2024
Mesa 2024 average sold price per square foot — the lowest among the four Portland silo destinations
SOURCE: ARMLS 2024 monthly data range (Metro Phoenix Homes / ARMLS)
ARMLS 2024 Annual Data (via FlexMLS)
The table below maps Portland equity positions to Mesa purchase prices at 20% down. The top two rows — the scenarios requiring the least equity — are unique to this page: in both cases, the Portland seller lands above Mesa’s median with a purchase that requires less equity than any other destination on this site.
Note the third row: a Portland homeowner with $140,000–$180,000 in net proceeds accesses the $700,000–$900,000 range — Mesa’s mid-tier — where approximately $270/sq ft delivers 2,600–3,333 square feet in well-established East Valley communities with active master-planned HOA infrastructure.
| Portland Net Proceeds (Estimated) | Down Payment (20%) | Mesa Purchase Price (Approx.) | Mesa Market Tier |
|---|---|---|---|
| ~$80,000–$99,000 | 20% | $400,000–$495,000 | At / near median (below median, surplus equity retained) |
| ~$99,000–$120,000 | 20% | $495,000–$600,000 | At / above median |
| ~$140,000–$180,000 | 20% | $700,000–$900,000 | Mid-tier |
| ~$180,000–$250,000 | 20% | $900,000–$1,250,000 | Upper-mid tier |
| ~$250,000–$360,000 | 20% | $1,250,000–$1,800,000 | Premium tier |
| Cash / large equity position | varies | $300,000–$495,000 | Below median; maximum debt reduction |
Net proceeds estimated at 94% of sale price after commissions, closing costs, and prorations. Mortgage balance estimates are representative; actual net depends on original loan terms, purchase year, and prepayment history. Consult your listing agent for a property-specific net sheet.
The first row — $80,000–$99,000 in proceeds — represents Portland sellers with smaller equity positions, perhaps purchased more recently or in a sub-market below the metro median. Even at this entry level, a Mesa purchase at $400,000–$495,000 at 20% down means a financed balance of $320,000– $396,000 — meaningfully lower than Chandler or Gilbert would require for a comparable purchase tier. Lower financed balance means lower monthly PITI before the first HOA fee is counted.
Mesa is Arizona’s third-largest city by population and among the largest in geographic footprint in the East Valley, spanning approximately 140 square miles. For Portland homeowners evaluating East Valley destination markets, this scale matters financially because it means Mesa carries the broadest inventory range of any destination covered on this site — from established sub-$500,000 grid neighborhoods in the city’s older west-side quadrants to luxury custom properties in the $1,500,000–$3,000,000+ range in East Mesa and the Red Mountain corridor.
That breadth means Portland equity holders are not channeled into a single price band when evaluating Mesa. The three price bands below describe what is available at each tier.
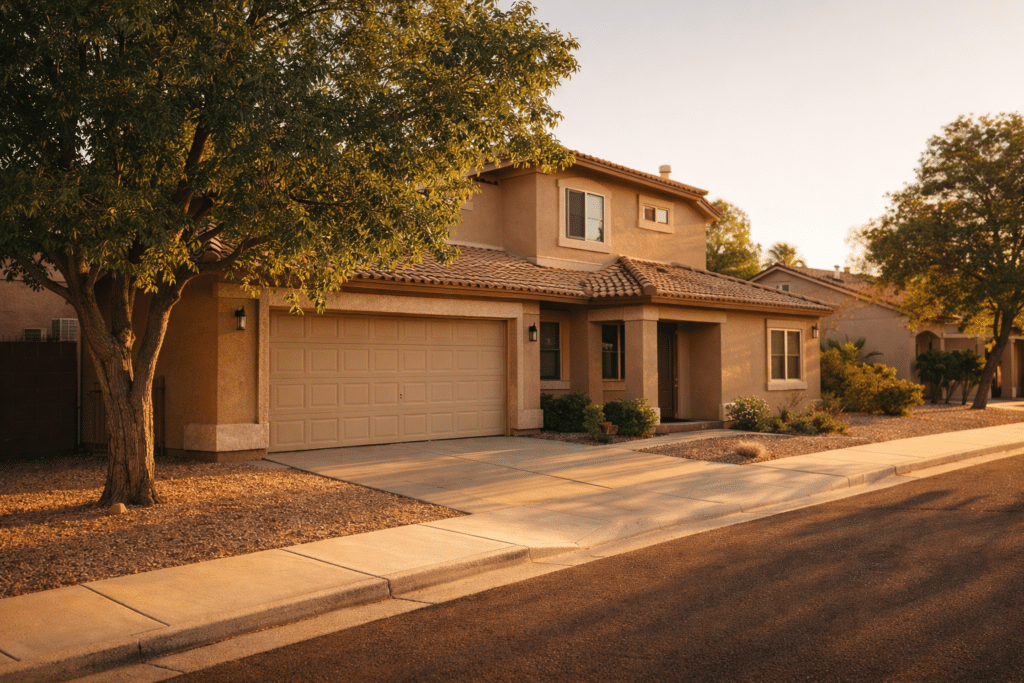
PRICE RANGE: $350,000–$495,000
TYPICAL SQ FT: 1,100–1,900 sq ft LOT SIZE: 4,000–7,500 sq ft (established grid; generally no HOA or minimal HOA governance)
YEAR BUILT RANGE: 1975–2005 (older established housing stock; many with updated mechanical systems and refreshed kitchens at this price tier)
DOM (2024): ~53 days citywide average (ARMLS 2024 estimate)
PROPERTY TAX EST. AT $422,500 MIDPOINT: ~$2,197/year at 0.52% effective rate (Maricopa County Treasurer)
PORTLAND EQUITY NEEDED FOR 20% DOWN: ~$85,000 at the $422,500 midpoint
HOA PRESENCE: Largely absent in older grid neighborhoods; present in some early master-planned developments at the upper end of this tier
INVENTORY CHARACTERISTIC: Mesa’s Entry band contains the Phoenix Valley’s largest concentration of affordable, established single-family inventory for Portland equity holders who prioritize low financed balance, no HOA governance, or maximum cash retention after purchase
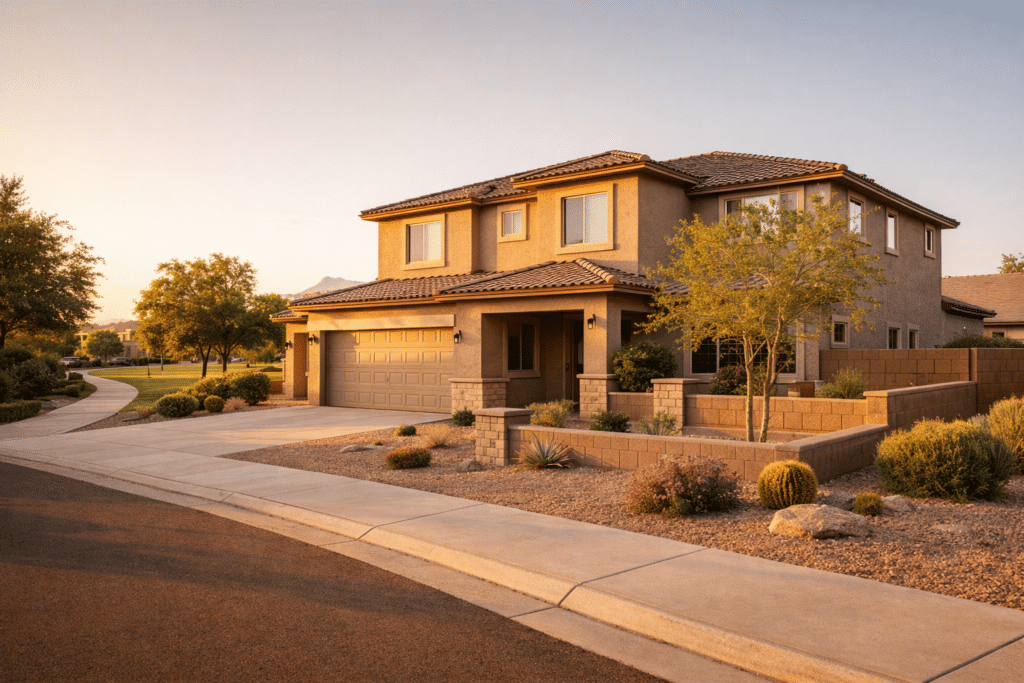
PRICE RANGE: $495,000–$850,000
TYPICAL SQ FT: 1,850–3,200 sq ft LOT SIZE: 6,000–12,000 sq ft; mix of HOA-governed master-planned communities and established non-HOA grid neighborhoods
YEAR BUILT RANGE: 1990–2018; newer construction mixed in
DOM (2024): ~53 days citywide average (ARMLS 2024)
PROPERTY TAX EST. AT $672,500 MIDPOINT: ~$3,497/year at 0.52% effective rate (Maricopa County Treasurer)
PORTLAND EQUITY NEEDED FOR 20% DOWN: ~$134,500 at $672,500 midpoint
HOA PRESENCE: Prevalent in master-planned communities in this tier; monthly fees typically range approximately $75–$225, covering common pool maintenance, park and greenbelt upkeep, and CC&R enforcement. Significant non-HOA inventory also exists in this band throughout central Mesa.
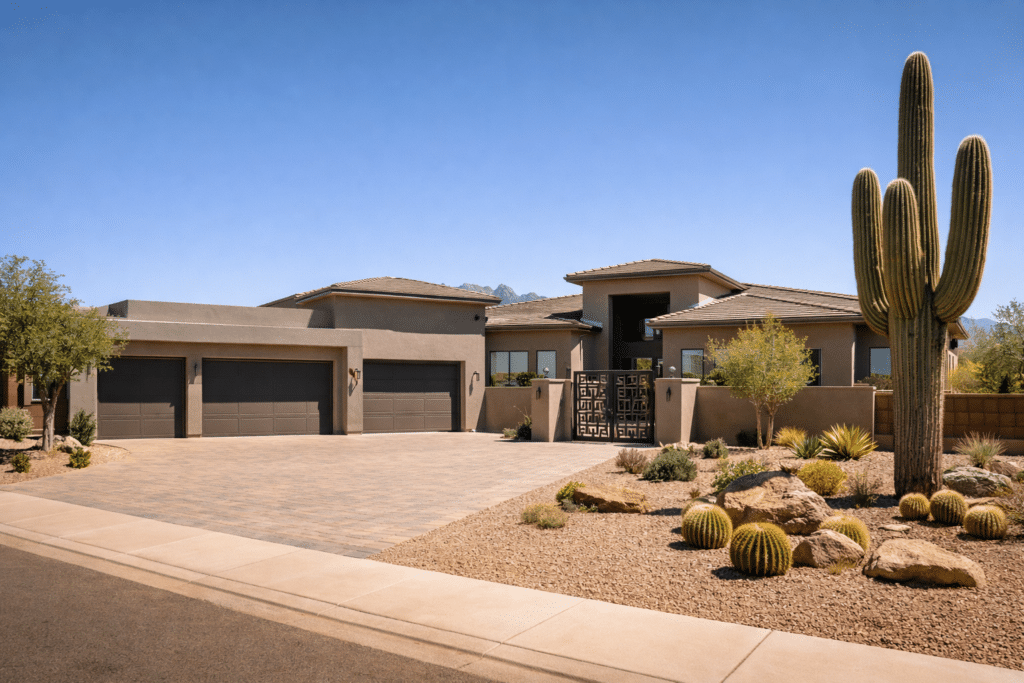
East Mesa / Red Mountain Corridor) PRICE RANGE: $850,000–$2,500,000+
TYPICAL SQ FT: 2,800–6,500+ sq ft LOT SIZE: 10,000–40,000+ sq ft; larger custom lots in east-side sub-markets
YEAR BUILT RANGE: 2000–present; substantial new and semi-custom construction in the outer east corridor; premium resale throughout
DOM (2024): Varies; luxury segment may extend above citywide average
PROPERTY TAX EST. AT $1,675,000 MIDPOINT: ~$8,710/year at 0.52% effective rate (Maricopa County Treasurer)
PORTLAND EQUITY NEEDED FOR 20% DOWN: ~$335,000 at $1,675,000 midpoint
HOA PRESENCE: Common in gated premium communities and active-HOA master- planned developments at this tier; fees range approximately $150–$500+/ month depending on amenity scope, gate access, and community size
At Mesa’s 2024 average of approximately $270–$275 per square foot, the physical space that Portland equity purchases is the most favorable dollar- to-square-foot conversion of any destination in the Portland silo. At equal purchase prices, Mesa delivers more square footage than Chandler ($300/sq ft) and Gilbert ($293/sq ft) — and at far lower prices than Scottsdale ($481/sq ft).
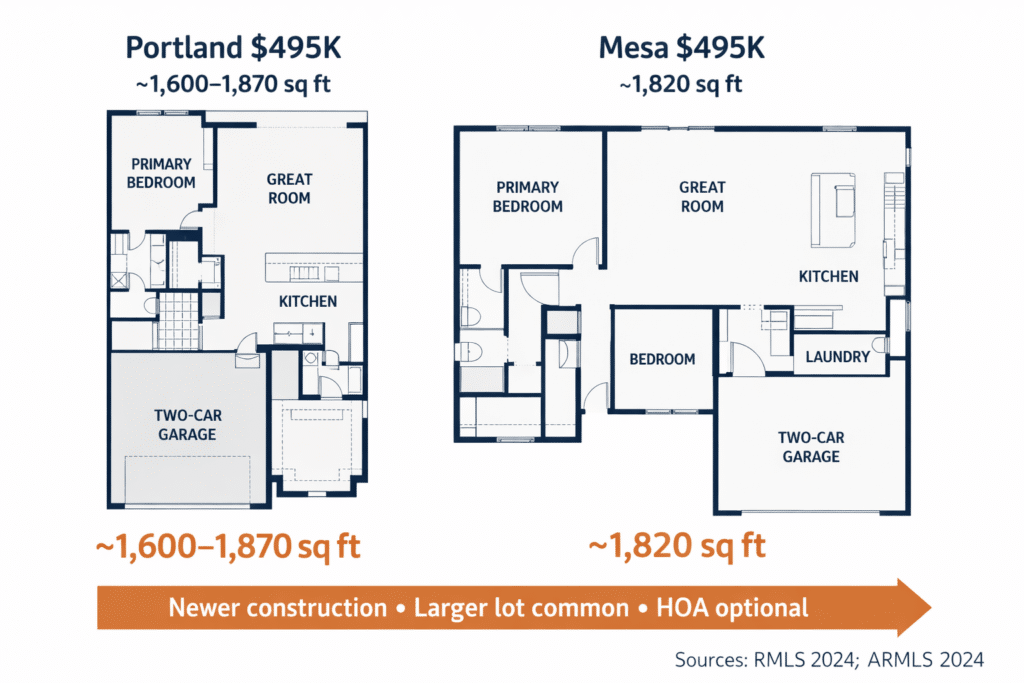
| Purchase Price | Portland Typical Sq Ft (at ~$265–$310/sq ft)* | Mesa Typical Sq Ft (at ~$272/sq ft avg)** |
|---|---|---|
| $400,000 | ~1,290–1,510 sq ft | ~1,471 sq ft |
| $495,000 | ~1,597–1,868 sq ft | ~1,820 sq ft |
| $600,000 | ~1,935–2,264 sq ft | ~2,206 sq ft |
| $750,000 | ~2,419–2,830 sq ft | ~2,757 sq ft |
| $900,000 | ~2,903–3,396 sq ft | ~3,309 sq ft |
| $1,100,000 | ~3,548–4,151 sq ft | ~4,044 sq ft |
At prices below $600,000, the raw square footage between Portland and Mesa is broadly comparable. At $750,000 and above, Mesa begins delivering measurably more square footage per dollar than the Portland market at the same price — reflecting the lower land cost in the East Valley relative to Portland’s constrained supply environment.
The financial case for Mesa is not built on square footage arithmetic at lower price points. It is built on three compounding factors:
1. The inverted median dynamic: Portland equity arrives above Mesa’s median, creating financial positioning rather than financial reach.
2. The property tax differential: approximately $1,287/year in Arizona’s favor at Mesa’s $495,000 median (Maricopa County Treasurer vs. Tax Foundation Oregon profile).
3. The income tax differential: Oregon’s combined Portland-area top rate reaching up to 13.9% versus Arizona’s 2.5% flat rate — a difference that compounds over every year of ownership.
A Portland homeowner who purchases at Mesa’s median, pays Arizona’s property tax rate, and pays Arizona’s income tax rate instead of Oregon’s for ten years accumulates a financial advantage that dwarf the per-square-foot comparison at any price point.
Oregon’s statewide average effective property tax rate is approximately 0.78% of market value (Tax Foundation; Kiplinger Oregon Tax Guide, 2024). Maricopa County — which encompasses all of Mesa — carries a median effective rate of approximately 0.52% (Maricopa County Treasurer; Ownwell, 2024). At Mesa’s $495,000 median, the annual property tax differential between Oregon and Arizona is approximately $1,287. At Mesa’s upper mid-tier, the differential widens proportionally.
Estimated annual property tax savings (AZ vs. OR) at Mesa’s 2024 median price of $495,000 SOURCE: Maricopa County Treasurer; Tax Foundation Oregon Profile, 2024
At Mesa’s mid-tier ($750,000): ~$1,950/year savings. 10-year cumulative at the median: ~$12,870 before income tax reduction or equity appreciation.

| Home Price | OR Effective Rate (~0.78%) | AZ Effective Rate (~0.52%) | Annual Tax Savings in Arizona |
|---|---|---|---|
| $500,000 | ~$3,900/year | ~$2,600/year | ~$1,300/year |
| $600,000 | ~$4,680/year | ~$3,120/year | ~$1,560/year |
| $700,000 | ~$5,460/year | ~$3,640/year | ~$1,820/year |
| $800,000 | ~$6,240/year | ~$4,160/year | ~$2,080/year |
| $900,000 | ~$7,020/year | ~$4,680/year | ~$2,340/year |
| $1,000,000 | ~$7,800/year | ~$5,200/year | ~$2,600/year |
Source: Maricopa County Treasurer (AZ effective rate ~0.52%); Tax Foundation / Kiplinger Oregon Tax Guide (OR effective rate ~0.78%, 2024). Rates expressed as percentage of market value. Individual assessed values may differ from market value; consult Maricopa County Assessor for property-specific data.
When Portland equity holders evaluate a destination market, the standard question is: how much equity do I need to purchase at the median? For Scottsdale, that number is approximately $227,000. For Gilbert, it is approximately $120,000. For Chandler, it is approximately $113,000. For Mesa, it is approximately $99,000.
But the inverted median creates a second, more consequential question: what does a Portland seller do with the excess equity after funding the down payment?
Consider a Portland homeowner who purchased in 2017 at $390,000 on a 30-year fixed mortgage. By 2024–2025, based on standard amortization and Portland’s appreciation trajectory, that homeowner likely holds $200,000–$260,000 in net equity after paying off the mortgage and covering transaction costs. A 20% down payment on a Mesa home at $495,000 requires $99,000. That leaves $101,000–$161,000 in uncommitted equity.
Apply additional proceeds to reduce the financed balance, lowering monthly PITI and lifetime interest cost. A 30% down payment on a $495,000 Mesa home ($148,500 down) reduces the financed balance to $346,500 — approximately $200/month lower PITI than the standard 20% down scenario at current rates.
Redirect excess equity toward a higher Mesa price tier — $700,000 to $900,000 — and enter Mesa’s mid-band at approximately 2,600–3,300 square feet with the same or a similar Portland equity position that would barely reach the Scottsdale or Gilbert median.
Maintain a cash reserve outside the transaction for home improvement, emergency fund replenishment, or investment, while purchasing at Mesa’s median with the minimum 20% down.
IMPORTANT: These scenarios are illustrative and depend on individual equity positions, purchase history, remaining mortgage balances, and financial goals. Consult a licensed financial professional and your listing agent for household-specific analysis.
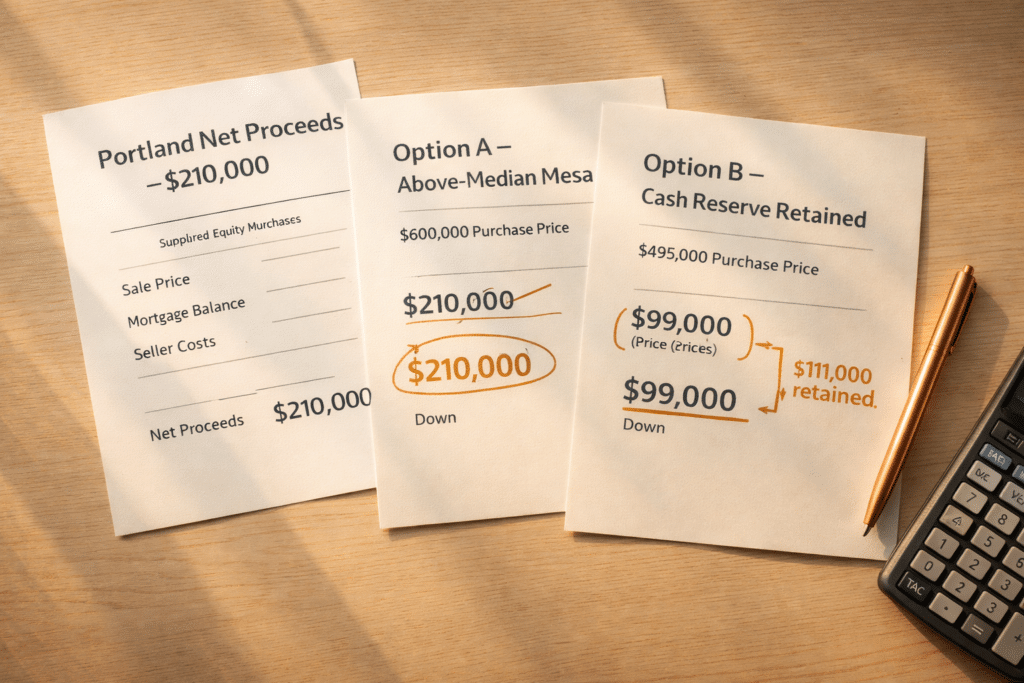
| Destination | 20% Down at Median | Financed Balance | Remaining Equity |
|---|---|---|---|
| Scottsdale | $227,000 needed | Not funded at $210K |
−$17,000 shortfall (below 20% at Scottsdale median) |
| Gilbert | $120,350 needed | $481,400 | $89,650 surplus |
| Chandler | $113,000 needed | $452,000 | $97,000 surplus |
| Mesa | $99,000 needed | $396,000 | $111,000 surplus |
Source: 20% × 2024 median sold price per market (ARMLS 2024 annual). Assumes $210,000 net proceeds after Portland sale costs and prorations.
NOTE: This table illustrates financial positioning only. All figures are representative and based on 2024 ARMLS medians. Individual transactions will differ. Consult your listing agent for property-specific analysis.
Mesa’s 2024–2025 market data presents a different picture than Chandler or Gilbert. Where those markets showed relatively tight inventory and steady absorption, Mesa entered 2025 with elevated inventory — approximately 163% of the three-year average (from 2022–2024) by mid-2025 per ARMLS data — and monthly sales volume running at approximately 93% of the three-year average. The ARMLS-derived price per square foot held within a $6 range throughout 2024, demonstrating price stability without appreciation momentum.
For Portland buyers, this context has a specific financial implication: Mesa is currently a buyer’s market in which negotiating room is more available than in Chandler or Gilbert. Sellers accepting below list price — the ARMLS source cited an average of approximately −$8,400 below asking in mid-2025 — means Portland buyers with organized finances and clear equity positions have more leverage in Mesa than in the tighter East Valley alternatives.
This is not a “distressed market” signal. It is a large, mature market with substantial supply normalizing after the constrained inventory of 2021– 2022. The buyer-favorable condition is a feature for Portland equity holders who are financially positioned but not in a rush to compete in a hot market.
The monthly carrying cost comparison at Mesa’s median shows a modest $57–$127/month advantage for Arizona. The income tax comparison shows a $7,650–$8,750/year advantage at a $150,000 household income — a figure that is not embedded in monthly PITI and does not appear in a mortgage payment. It appears on the tax return.
Portland-area residents face a three-layer earned income tax structure that reaches a combined top rate of up to 13.9% (Tax Foundation, 2026 State Tax Competitiveness Index):
LAYER 1 — Oregon state income tax: 4.75% to 9.9%, reaching the top bracket at $125,000 single / $250,000 joint.
LAYER 2 — Multnomah County income tax: 1.5% to 3%, applied above $125,000 single / $200,000 joint.
LAYER 3 — Metro Supportive Housing Services tax: 1% flat, applied above $125,000 single / $200,000 joint.
Arizona’s flat income tax rate: 2.5%. No county surcharge. No metro-level income tax.
AT $150,000 HOUSEHOLD INCOME — ESTIMATED ANNUAL TAX DIFFERENTIAL:
Oregon combined (estimated blended, ~$150K income): ~$11,400–$12,500 Arizona flat rate (2.5% of $150,000): ~$3,750 Estimated annual income tax savings in Arizona: ~$7,650–$8,750
Combined annual advantage (income + property tax at Mesa median): approximately $8,940–$10,040 per year for a representative $150,000 household purchasing at Mesa’s 2024 median.
IMPORTANT: These estimates are illustrative only. Individual tax liability depends on filing status, deductions, credits, and other income. Consult a licensed tax professional for household-specific projections.
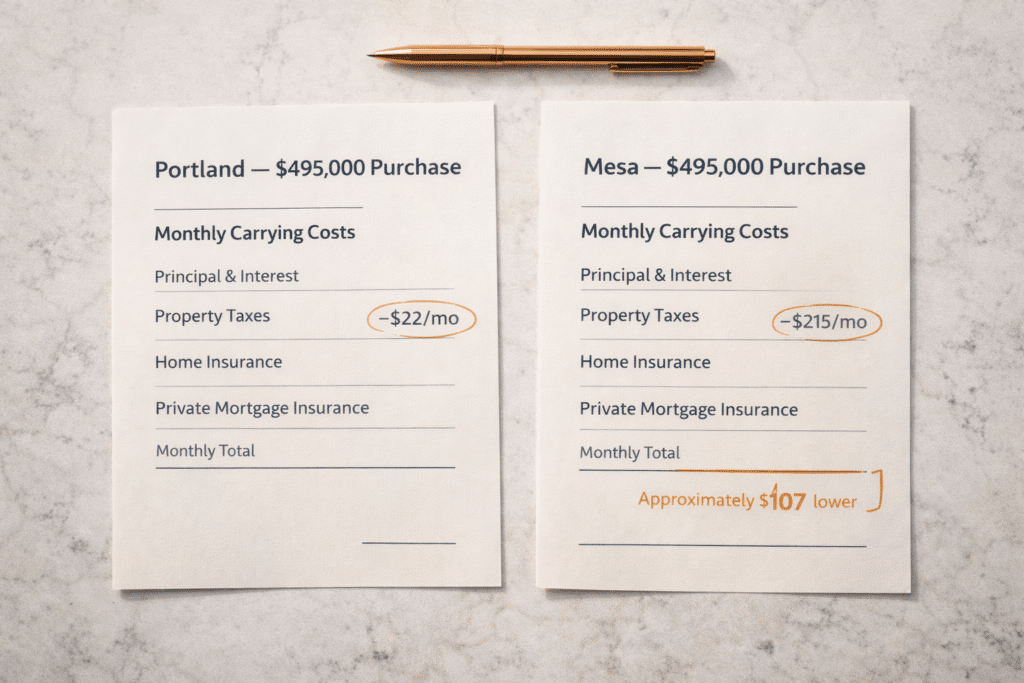
At Mesa’s median without an HOA, the monthly carrying cost is approximately $57–$127 per month lower than an equivalent Portland home at the same price — driven entirely by the property tax differential. With a mid-range HOA fee, the carrying cost is approximately comparable to or modestly higher than Portland at the same price.
This is the honest version of the Mesa carrying cost story: the monthly advantage at the same purchase price is real but modest — roughly $57–$127/month depending on HOA. The larger financial advantage of Mesa lives in two places: the equity surplus that Portland sellers bring above the Mesa median (which reduces the financed balance); and the income tax line, which is not reflected in monthly PITI.
| Metric | Value / Source |
|---|---|
| 2024 Median Sold Price (single-family) | $495,000 (ARMLS, 2024 annual) |
| 2024 Average Sold Price (single-family) | $562,613 (ARMLS, 2024 annual) |
| 2024 Avg. Sold Price per Sq Ft | ~$270–$275/sq ft (ARMLS, 2024) |
| YoY Median Price Change (2023→2024) | +4.2% ($475,000→$495,000, ARMLS) |
| YoY Avg. Price Change (2023→2024) | +5.2% ($534,631→$562,613, ARMLS) |
| 2024 Avg. Days on Market (est.) | ~53 days (ARMLS / Redfin cross-ref) |
| 2025 Inventory Status (mid-2025) | ~163% of 3-yr avg (ARMLS data, Metro Phoenix Homes, Jul 2025) |
| Avg. Sale-to-List Spread (mid-2025) | ~−$8,400 below asking (ARMLS/MPH) |
| Maricopa County Eff. Property Tax Rate | ~0.52% (Maricopa County Treasurer) |
| City Build-Out Status | Mix: established west/central grid; active development in east corridor |
| HOA Presence | Variable by sub-market; absent in older grid; prevalent in east-side master-planned communities |
Source: ARMLS transaction data via SWEE Phoenix Homes / FlexMLS (2024 annual); Metro Phoenix Homes / ARMLS monthly market report (Jul 2025); Maricopa County Treasurer; Ownwell Maricopa County property tax analysis, 2024.
The elevated inventory context also speaks to Portland sellers who worry about a Mesa market that could decline after purchase. In a large, built-out East Valley city with diversified employment infrastructure — including the Mesa area’s technology, healthcare, and manufacturing employment base — the supply normalization of 2024–2025 is not the same risk profile as a market dependent on a single sector. The long-term fundamental demand for a well- located East Valley city with Maricopa County’s 0.52% effective property tax rate and direct freeway access is more durable than a short-term inventory comparison would suggest.
For the full employment infrastructure context relevant to the Mesa corridor, see the
Our brokerage partner, West USA Realty, represents buyers relocating to Gilbert, Chandler, Scottsdale, and all Phoenix Valley communities. Connect directly with a licensed Arizona agent at westusa.net.

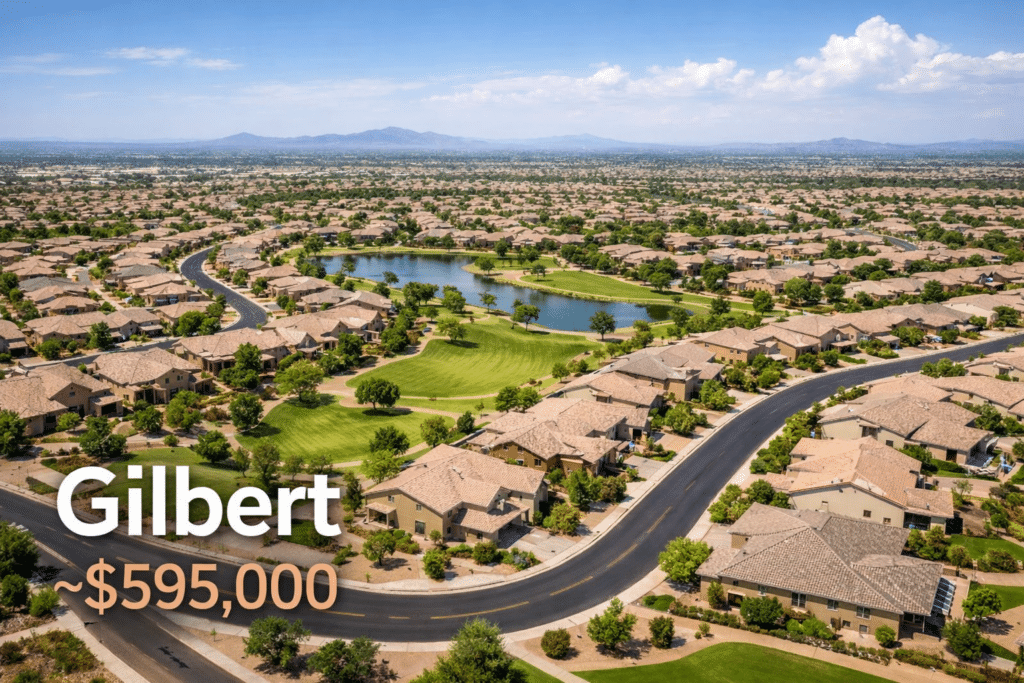
2024 Median: $601,750 | $293/sq ft | 20% down at median: ~$120,000
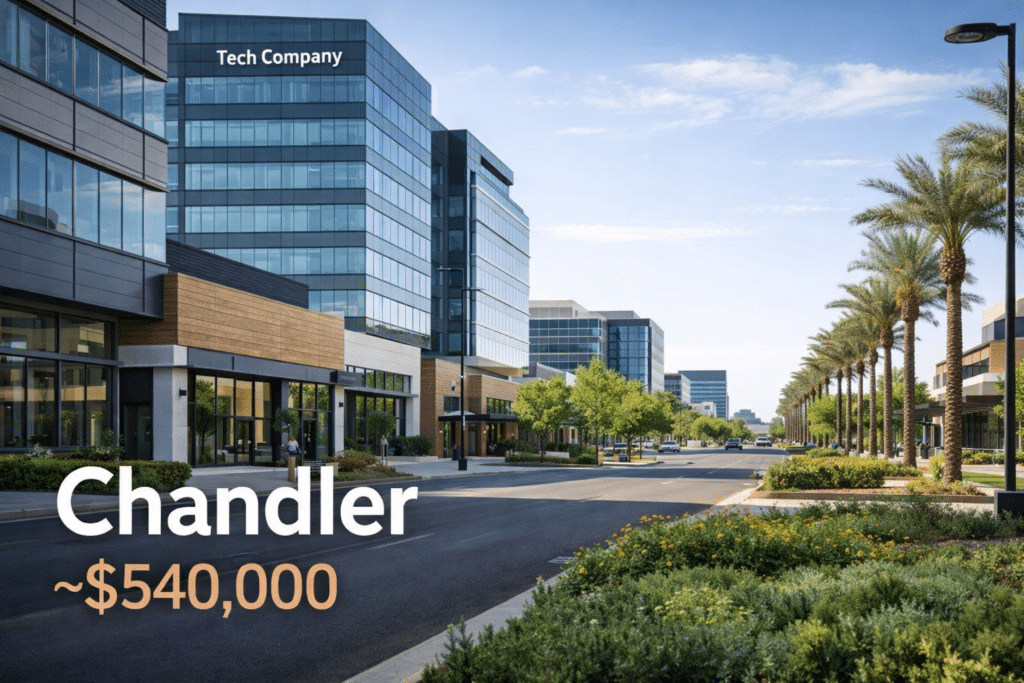
2024 Median: $565,000 | $300/sq ft | 20% down at median: ~$113,000
| Market | 2024 Median Sold Price | Avg. Price/Sq Ft | 2024 DOM (Est.) | Notes for Portland Buyers (financial context only) |
|---|---|---|---|---|
| Mesa | $495,000 | ~$272/sq ft | ~53 days | ONLY destination below Portland's median; lowest equity threshold; buyer-favorable inventory conditions |
| Chandler | $565,000 | $300/sq ft | 48 days | Tightest DOM; fully built-out; entry at $28K above Portland median |
| Gilbert | $601,750 | $293/sq ft | ~60–65 days | Newer construction in outer bands; HOA-heavy mid-tier |
| Scottsdale | $1,135,000 | $481/sq ft | 79 days | Requires largest equity position; premium tier East Valley |
Source: ARMLS 2024 annual data; all figures single-family homes.
A: The 2024 full-year median sold price for single-family homes in Mesa was $495,000 — a 4.2% increase from 2023’s median of $475,000 — according to ARMLS transaction data via FlexMLS. The 2024 average sold price was $562,613 (+5.2% from $534,631 in 2023). The 2024 average sold price per square foot was approximately $270–$275, reflecting a tight $6 range held consistently throughout 2024 per ARMLS monthly market data.
A: Mesa is the only Portland-silo destination on this site where the 2024 median sits below Portland’s metro median of approximately $537,000. At $495,000, a Portland homeowner with as little as $99,000 in net proceeds can make a 20% down payment at or above Mesa’s median. Portland sellers with $140,000–$250,000 in proceeds can access Mesa’s $700,000–$1,250,000 tier, where approximately $272/sq ft delivers 2,600–4,600 square feet. Sellers with larger equity positions who purchase at Mesa’s median — rather than reaching for a higher-priced market — can reduce their financed balance and lower monthly carrying costs.
A: Among the mid-range East Valley destinations in the Portland silo, Mesa has the lowest 2024 median at $495,000 (vs. Chandler’s $565,000 and Gilbert’s $601,750), the lowest price per square foot (~$272/sq ft vs. $300 and $293), and — as of mid-2025 — the most buyer-favorable inventory conditions. The tradeoff is that Mesa carries more inventory and more variable HOA governance across its sub-markets, with older grid neighborhoods without HOA and established master-planned communities with active HOAs coexisting across the city’s 140-square-mile footprint.
A: Mesa is within Maricopa County, where the median effective property tax rate is approximately 0.52% of market value (Maricopa County Treasurer; Ownwell, 2024). On Mesa’s 2024 median of $495,000, the estimated annual property tax is approximately $2,574. Oregon’s statewide average effective rate of 0.78% produces an estimated bill of approximately $3,861 on the same value — a savings of roughly $1,287 per year in Arizona’s favor.