San Bernardino County home prices rose 144% over the past decade — more than 50 percentage points faster than the California statewide average. That compounding appreciation did something concrete: it built equity inside your home, equity that now sits largely idle in California’s cost and tax structure. This guide decodes what that equity is worth in the Phoenix Valley — in square footage, in monthly payments, and in annual taxes retained.
San Bernardino County’s housing market delivered one of the most dramatic ten-year runs in Southern California. A home purchased for $213,000 in January 2015 — the county median at that time — reached approximately $515,000 by late 2025, according to California Association of Realtors data and the San Bernardino County Community Indicators project. That is a nominal gain of approximately $302,000 in a single asset.
For homeowners who have not refinanced to extract that equity, or who refinanced modestly, that $302,000 or more in accumulated value is largely untapped capital — a balance sitting inside a California asset, subject to California’s cost of living and tax structure, earning nothing further unless it is put to work.
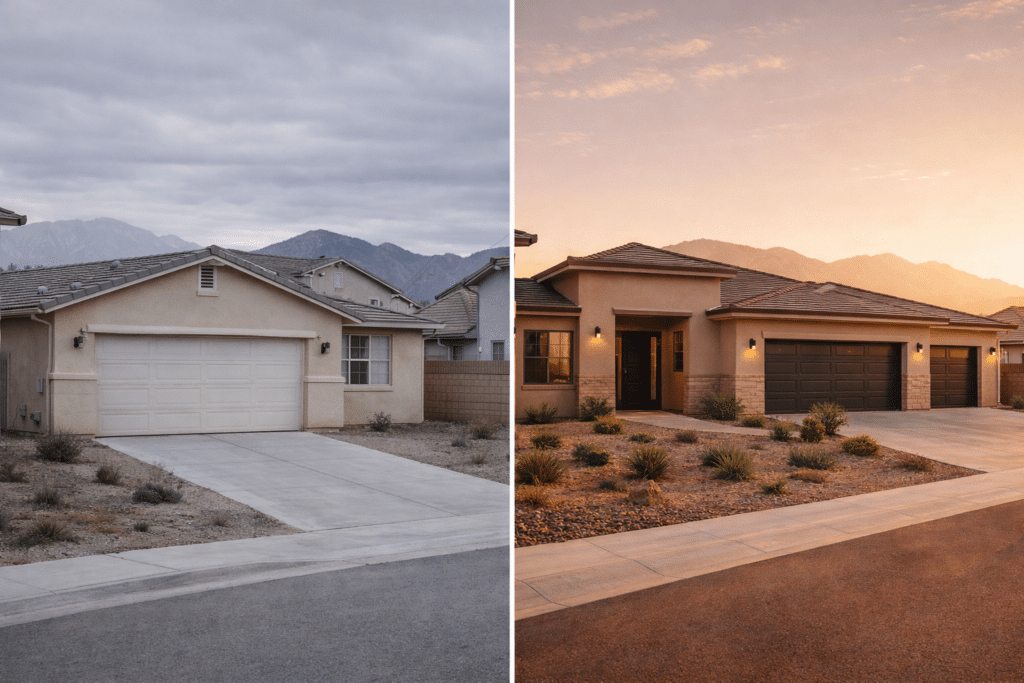
The San Bernardino County median home price reached approximately $515,000 by late 2025 (CAR). Maricopa County’s concurrent median held at approximately $485,000 (ARMLS, 2025). At current market prices, the two counties are near parity — which means a San Bernardino County homeowner does not give up a meaningful purchase price advantage by moving to Arizona. What they gain instead is the elimination of California’s cost and tax overhead on that same equity, immediately and permanently.
SB County Home Price (Jan 2025)
Source: California Association of Realtors / SB County Community Indicators
SB County 10-Year Appreciation (Jan 2015 – Jan 2025)
Source: CAR / SB County Community Indicators
Maricopa County Median Home Price (2025)
Source: ARMLS, 2025

Source: CAR / SB County Community Indicators
The proximity of San Bernardino County and Maricopa County median prices tells only part of the story. The price-per-square-foot differential reveals the rest.
San Bernardino County’s median price per square foot ran approximately $334 in late 2025. Maricopa County’s concurrent ARMLS figure was approximately $265 per square foot — a 26% discount on every square foot of living space purchased in Arizona, before accounting for lot size, home age, or construction quality.
Run a $500,000 budget through both markets and the output is unambiguous:
| Market | $500,000 Budget | Approx. Square Footage |
|---|---|---|
| San Bernardino Co. | $500,000 | ~1,497 sq. ft. |
| Maricopa County | $500,000 | ~1,887 sq. ft. |
| Difference | +390 sq. ft. (+26%) |
That 390 square feet is a bedroom, a home office, or a three-car garage on a home that otherwise costs the same number of dollars. The purchase price is near-identical. The physical outcome is not.
For San Bernardino County buyers whose equity does not exceed the Arizona median — or who simply want to replicate their current square footage at a lower price point — Arizona’s per-square-foot discount produces a materially lower total purchase price for the same size home. That difference funds closing costs, a pool, or an accelerated mortgage payoff.
For San Bernardino County homeowners, the purchase price near-parity with Maricopa County is not the primary financial argument for relocation. The tax argument is — and it compounds every year you remain in Arizona.
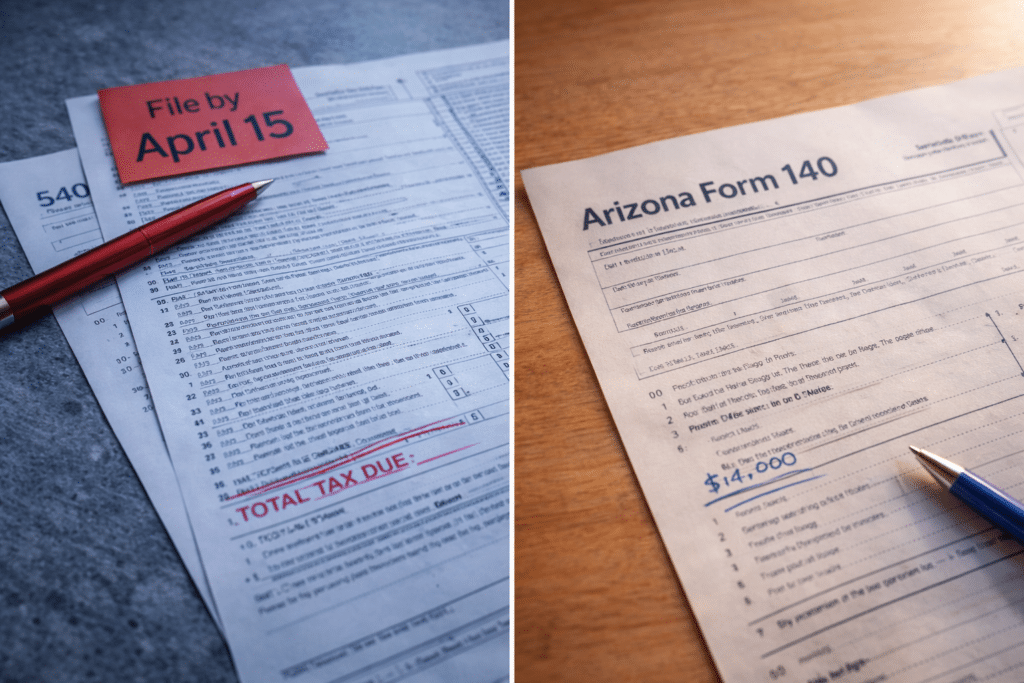
The moment a San Bernardino County homeowner sells and buys again — anywhere in California — Proposition 13’s protection resets. The new purchase is assessed at full market value. In San Bernardino County, the effective property tax rate on new purchases runs approximately 1.15% to 1.20%, accounting for the base 1% statutory rate plus local assessments, special district levies, and voter- approved bonds that vary by jurisdiction (Tax Foundation; San Bernardino County tax rate analysis, Victor Valley Times / BlockShopper Q4 2024).
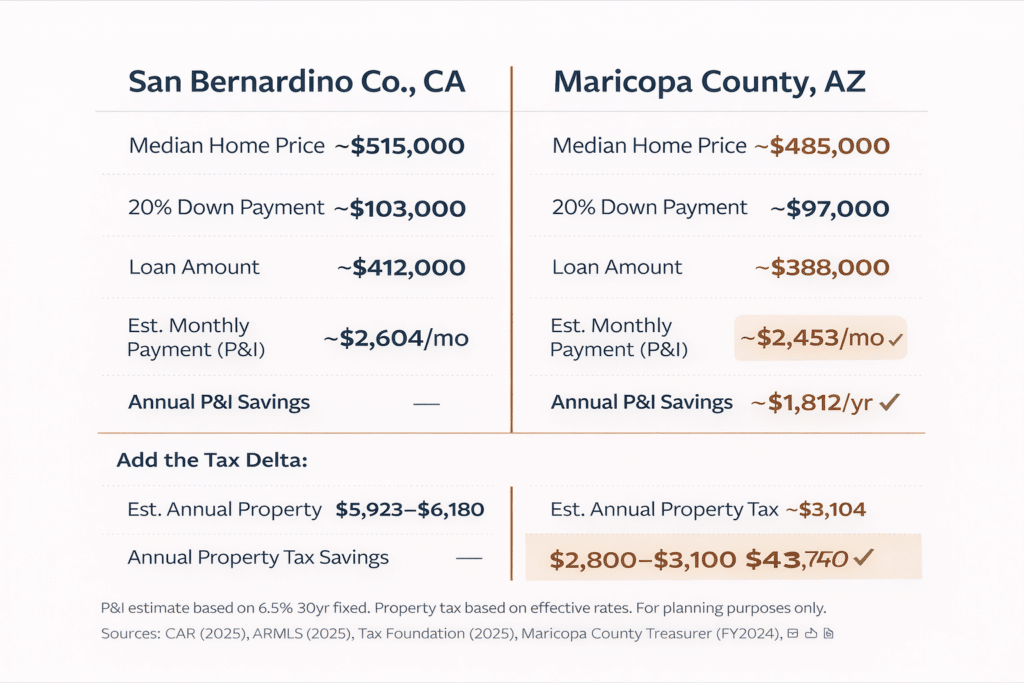
On a $515,000 San Bernardino County purchase, a new buyer faces an estimated annual property tax of approximately $5,923 to $6,180 or more at those rates.
In Maricopa County, the effective residential property tax rate held at approximately 0.64% in FY2024 (Maricopa County Treasurer). On a $485,000 Arizona purchase, that produces an estimated annual bill of approximately $3,104.
Annual property tax savings versus a new SB County purchase at current median: approximately $2,800 to $3,100 per year or more — money that stays in the household rather than flowing to local California tax jurisdictions.
California’s top marginal income tax rate reaches 13.3%, the highest of any state (Tax Foundation, 2025). Arizona operates a flat income tax of 2.5% — the lowest flat rate among all states with an income tax (Tax Foundation, 2025).
For a San Bernardino County household earning $150,000 annually, the difference in state income tax liability between California and Arizona can exceed $10,000 per year when California’s full graduated bracket structure and related levies are applied. Over a ten-year horizon, that income tax differential represents $100,000 or more in retained household capital.
San Bernardino County’s median household income was $88,294 according to the U.S. Census Bureau’s 2024 American Community Survey — a household in that income range moving from California to Arizona may retain an additional $4,000 to $7,000 annually in state income tax savings alone, depending on income sources, deductions, and filing status.
Label: SB County Effective Property Tax Rate (New Purchase)
Source: Tax Foundation; Victor Valley Times / BlockShopper Q4 2024
Maricopa County Effective Property Tax Rate
Source: Maricopa County Treasurer, FY2024
California Top State Income Tax Rate
Source: Tax Foundation, 2025
Arizona Flat State Income Tax Rate
Source: Tax Foundation, 2025
Because San Bernardino County and Maricopa County median prices are near parity, the monthly payment comparison here is not primarily a story about a lower loan amount. It is a story about what the same equity — deployed at current Arizona prices — does to the household’s total monthly cost picture when taxes and insurance are layered in.
Using current median prices and prevailing mortgage rates as a reference, with a 20% down payment and a 6.5% 30-year fixed rate (consistent with the BLS / Federal Reserve rate environment in late 2025):
| Scenario | Purchase | Down (20%) | Loan | Est. Mo. P&I |
|---|---|---|---|---|
| San Bernardino Co. | $515,000 | $103,000 | $412,000 | ~$2,604/mo |
| Maricopa County | $485,000 | $97,000 | $388,000 | ~$2,453/mo |
| Monthly P&I Savings | ~$151/mo | |||
| Annual P&I Savings | ~$1,812/yr |
The P&I difference is modest — approximately $151 per month — because the purchase prices are close. The more powerful savings come from layering in the property tax differential (approximately $230–$260 per month less in Maricopa County on a new purchase at these prices) and the state income tax delta (potentially $350–$850+ per month depending on income). Combined, the total monthly housing cost reduction for a San Bernardino County homeowner moving to Maricopa County can reach $700 to $1,200 or more per month — even before counting the additional square footage gained per dollar spent.
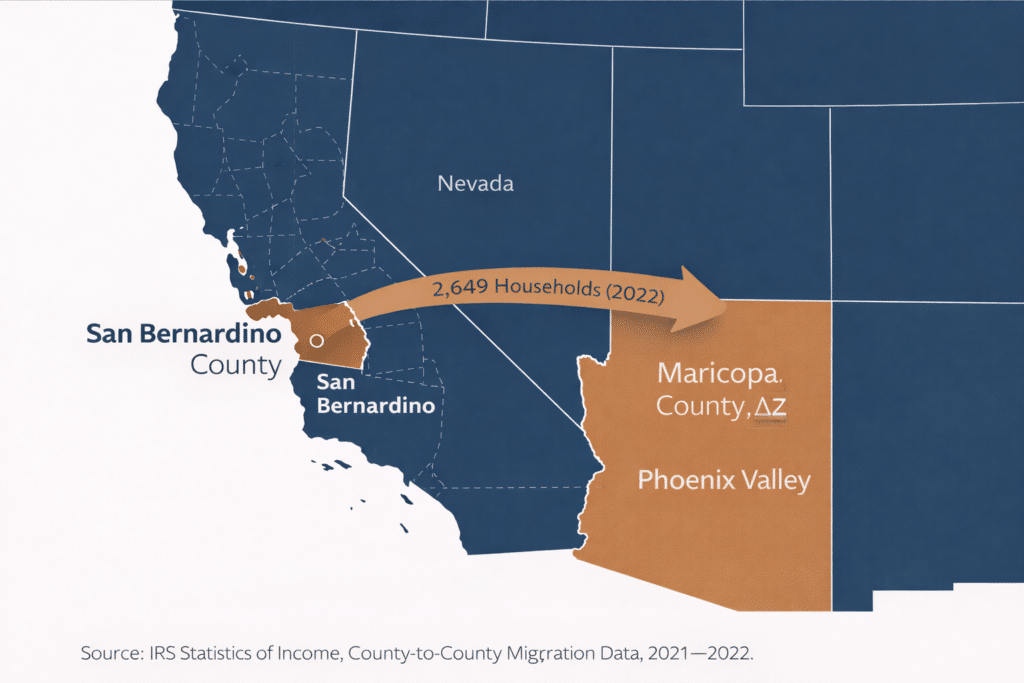
Approximately 2,649 households relocated from San Bernardino County to Maricopa County in the 2021–2022 filing year, according to IRS Statistics of Income county-to-county migration data. These are income-filing households acting on deliberate financial decisions — not transient relocations.
When combined with the 3,302 Riverside County households who made the same move in that year (IRS SOI, 2021–2022), the Inland Empire-to-Maricopa corridor accounted for nearly 6,000 relocating households in a single filing year — one of the highest-volume California-to-Arizona migration routes in the IRS dataset.
The financial case in each household is the same calculation this page runs: California equity, freed from California’s cost structure, relocated to a market where that equity buys more space, incurs lower taxes, and produces a lower monthly cost obligation from day one.
SB County → Maricopa County (2022)
Source: IRS SOI, 2021–2022 Filing Year
SB County Median Household Income
Source: U.S. Census Bureau, ACS 2024
SB County 10-Year Home Price Appreciation
Source: CAR / SB County Community Indicators (Jan 2015–Jan 2025)
San Bernardino County’s median home price positions most homeowners to purchase at or above the Maricopa County median with meaningful remaining equity — opening the full range of Phoenix Valley communities.
Our brokerage partner, West USA Realty, represents buyers relocating to Gilbert, Chandler, Scottsdale, and all Phoenix Valley communities. Connect directly with a licensed Arizona agent at westusa.net.

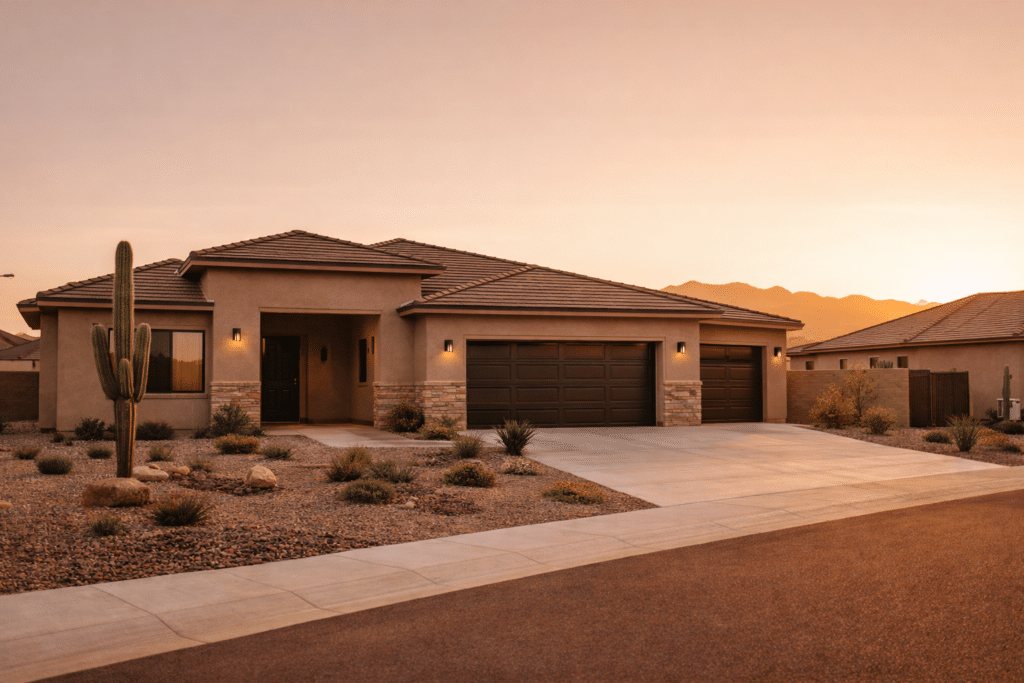
Gilbert’s new-construction inventory and east Valley infrastructure are a common landing point for SB County equity buyers. Homes priced $450,000–$600,000 deliver 2,200–3,000 sq. ft. with three-car garages and pool-ready lots — outcomes that are not achievable at equivalent price points in San Bernardino County.
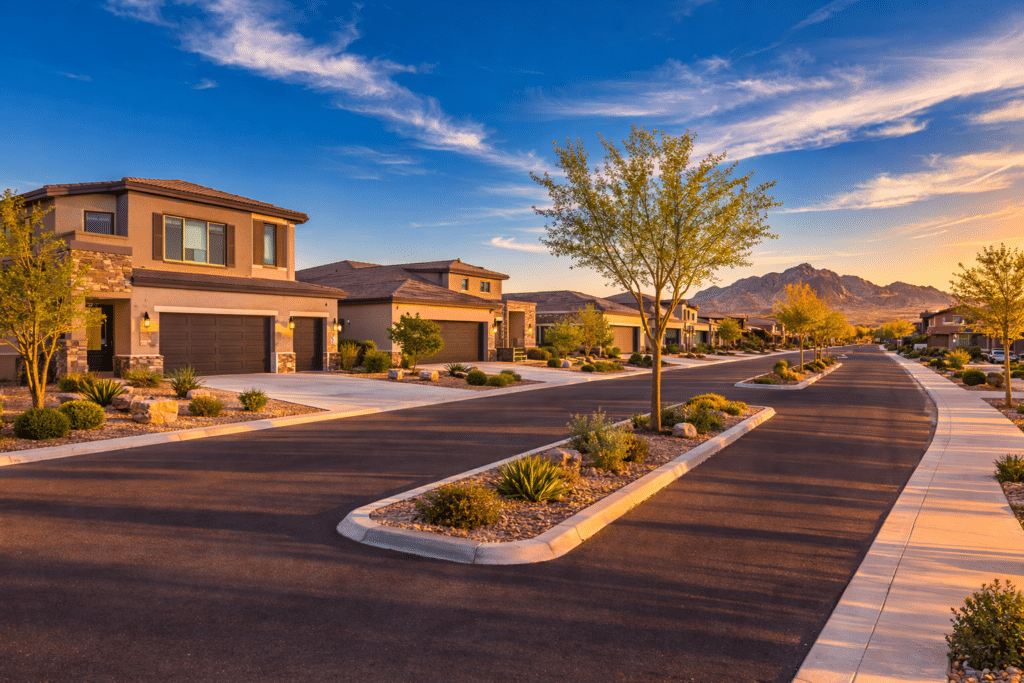
Mesa consistently ranks among the strongest value propositions in the east Valley — established infrastructure, strong new-construction supply, and pricing that meets SB County equity buyers at or below the Maricopa County median.
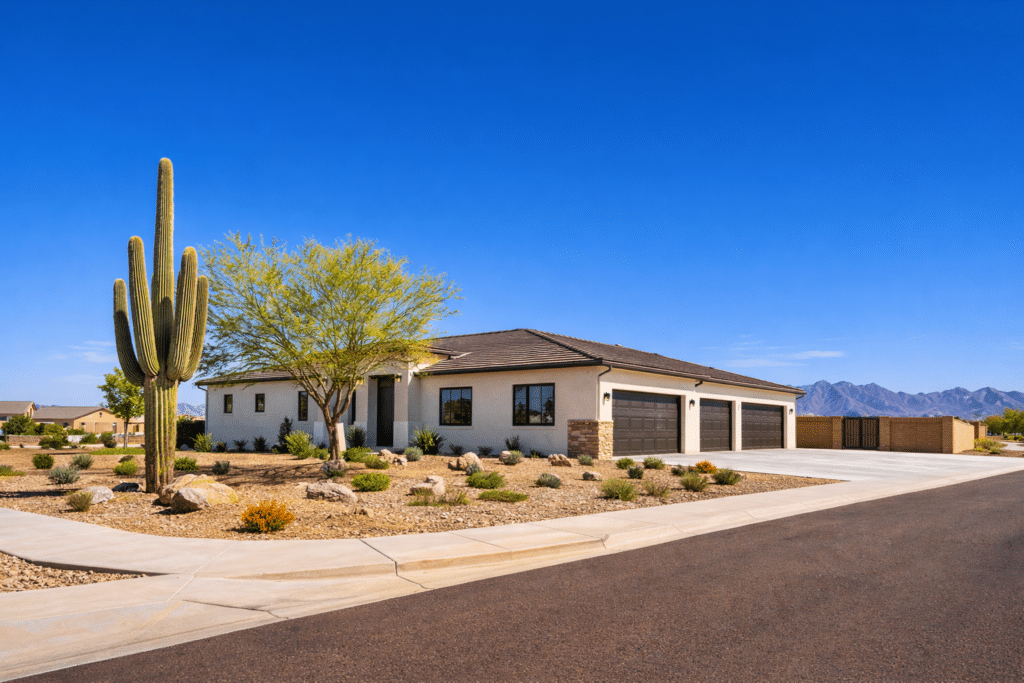
Surprise and Goodyear deliver the highest land-per-dollar ratio in the Phoenix Valley — the right destination for SB County buyers who want to maximize lot size and outdoor square footage with their accumulated equity.