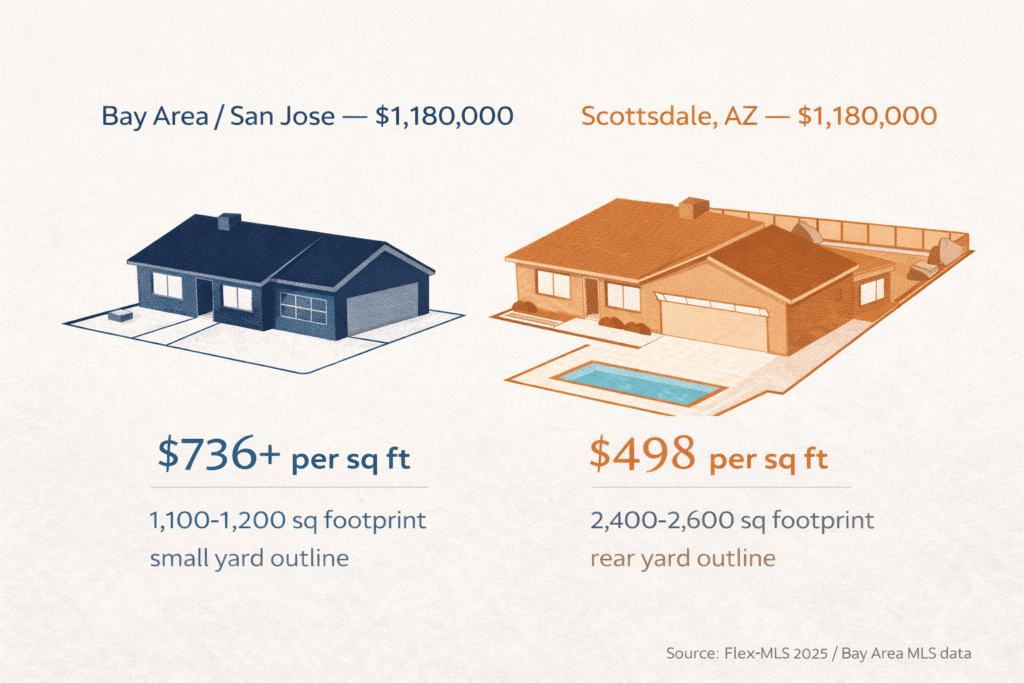
Scottsdale’s 2025 full-year median sold price is $1,180,000 — the highest in the Phoenix Valley. At $498 per square foot, that median translates to approximately 2,300–2,500 square feet of single-family housing. In Palo Alto or San Jose, $1,180,000 typically buys a much smaller, lot-line product with older finishes. The product gap — not pure cash retention — is the financial case at Scottsdale’s tier.
Scottsdale is not Gilbert or Chandler. Its 2025 full-year median of $1,180,000 — up 4.0% from $1,135,000 in 2024 — makes it the Phoenix Valley’s highest-priced primary destination market. Average price per square foot is $498. These numbers imply a specific California seller profile: substantial net proceeds built through years of appreciation in high-cost California markets.
That distinction changes how to evaluate Scottsdale. The financial case here is not maximizing cash left over after purchase. It is maximizing product value per dollar at a comparable capital commitment. A California household deploying $1.1M–$1.4M of net proceeds into Scottsdale may not retain the six-figure cash position that a Gilbert purchase can produce — but they typically acquire materially more square footage, newer systems, and better-equipped property than that same money buys in California luxury tiers, with Arizona’s state income tax savings compounding every year of ownership.
In Silicon Valley and Peninsula submarkets, single-family product in comparable condition routinely prices above $1,000 per square foot (and higher in premium corridors). In Los Angeles luxury submarkets, comparable single-family inventory often clears $700–$1,000 per square foot. At $498 per square foot, Scottsdale delivers dramatically more physical product for the same dollar commitment.

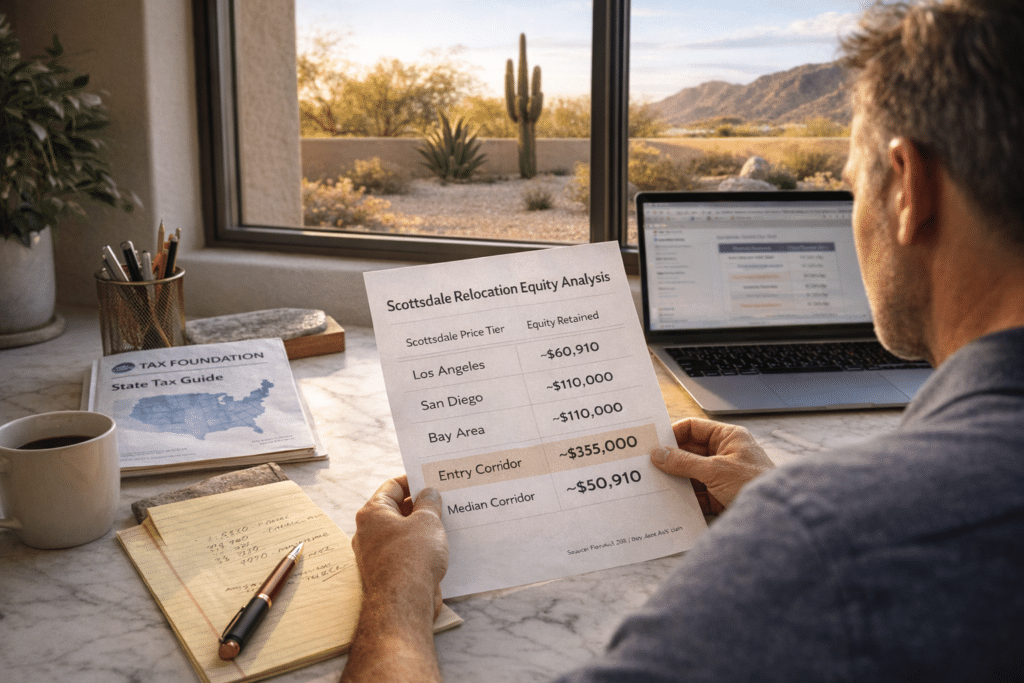
Because Scottsdale’s median exceeds the net proceeds of many California sellers under the $1M sale threshold, the relevant question is tier access: which Scottsdale band your net proceeds reach, and what retention looks like at that tier. Assumptions: ~6% transaction costs on California sale; Arizona closing costs ~ $15,000–$22,000 at Scottsdale price points.
| California Origin | CA Median | Est. Net Proceeds | Scottsdale Tier Accessible | Price Range | Est. Equity Retained |
|---|---|---|---|---|---|
| Los Angeles County | $890,910 | ~$837,000 | Entry | $700K–$850K | ~$0–$115K |
| San Diego County | ~$950,000 | ~$893,000 | Entry–Mid | $750K–$890K | ~$0–$120K |
| SF / Bay Area | ~$1,200,000 | ~$1,128,000 | Mid | $950K–$1,150K | ~$0–$155K |
| San Jose / Silicon Valley | ~$1,500,000 | ~$1,410,000 | Mid–Premium | $1.0M–$1.4M | ~$0–$385K |
Sources: C.A.R. (Dec 2025); FlexMLS (Scottsdale, 2025 full-year); Maricopa County closing cost estimates. Figures are estimates; retained equity at the low end assumes purchases near the top of the accessible tier.
Reading this table correctly: an LA County seller purchasing at ~$800,000 in Scottsdale may retain only a small cash position after transaction costs. The rationale for that buyer is not large retained equity; it’s Scottsdale-tier product value per dollar and the recurring Arizona income tax savings. A San Jose seller purchasing at the $1,180,000 Scottsdale median retains roughly $205,000–$225,000 while acquiring a property that often requires far more capital in comparable California luxury corridors.
Scottsdale’s citywide median hides distinct corridor behavior. For California buyers, the relevant question is which sub-market fits the price tier your net proceeds reach.
Older housing stock (1960s–1980s), smaller footprints (often ~1,400–2,000 sq ft), price-per-square-foot typically below citywide average. Entry point for LA and San Diego sellers seeking Scottsdale access. Loop 101 proximity supports connectivity.
Wide mix of resale, renovated mid-century inventory, and attached “lock-and-leave” product. Price varies sharply by micro-location and renovation level. Lot sizes range from infill patterns to larger estate lots.
Master-planned communities with HOA-governed common areas and larger lots (often ~8,000–20,000 sq ft). Resale inventory spans 1980s–2000s construction. Common target band for Bay Area sellers deploying ~$1.1M–$2M.
Newer-construction concentration, proximity to Loop 101, mixed gated and HOA product. Typical footprints ~2,500–4,000 sq ft. Common fit for Bay Area and San Jose buyers targeting newer stock
Guard-gated and golf-course community patterns, larger estate homes (often 3,500–8,000+ sq ft) on larger lots. Access typically requires $1.4M–$2.5M+ proceeds or financing.
Larger mature lots (often ~8,000–20,000 sq ft) with constrained inventory and high demand. A frequent target for high-equity buyers seeking larger-lot product with strong corridor connectivity.
Price ranges are approximations from trailing sales distributions; individual transactions vary by lot, condition, and renovations.
For Bay Area and Silicon Valley households, price-per-square-foot is the most direct comparison tool. Scottsdale’s 2025 average is $498/sq ft, with many North Scottsdale and McCormick Ranch corridors trading in the ~$450–$550 range for 2,500–4,000 sq ft product.
In Silicon Valley and Peninsula submarkets, comparable single-family homes often trade above $1,000/sq ft, and some corridors exceed $1,500/sq ft. In Los Angeles luxury tiers, comparable single-family inventory commonly runs ~$700–$1,100/sq ft.
For a high-equity California seller, the Scottsdale move can be a balance-sheet restructuring: similar capital outlay, materially different physical property outcome, and a recurring income tax delta that compounds with every year of Arizona residency.
Approximate ratio of California luxury price-per-square-foot versus Scottsdale’s $498 average — meaning Scottsdale can deliver roughly twice the square footage per dollar at comparable luxury price tiers.
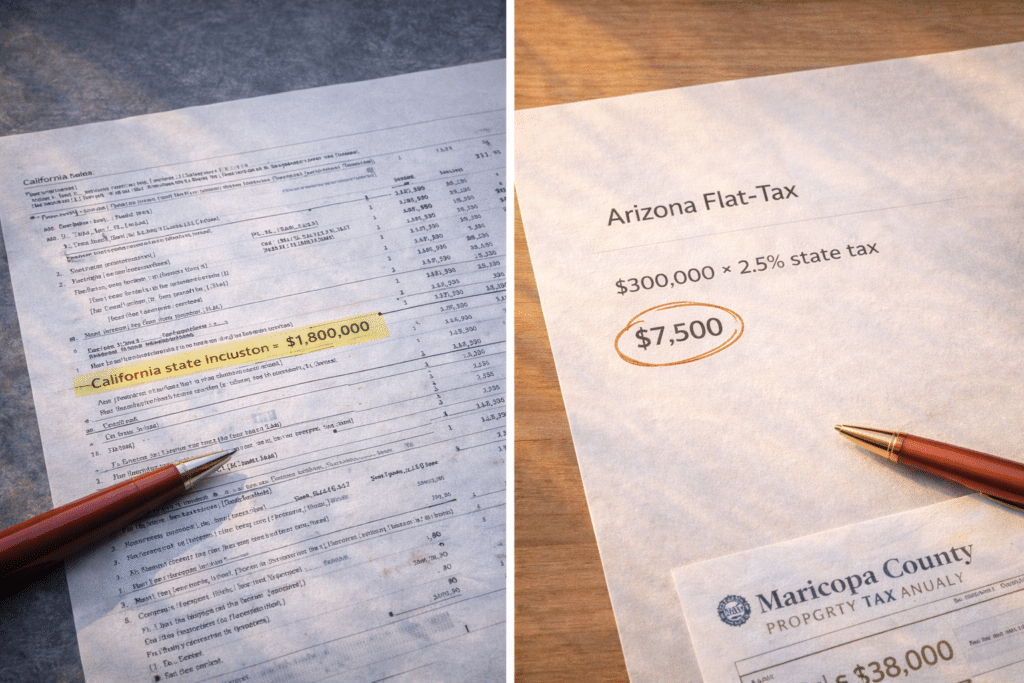
At Scottsdale’s tier, the income-tax differential is often one of the biggest recurring levers because many Scottsdale-target buyers are high-income households. A $300,000 household in California can pay ~$27,000–$32,000/year in state income tax. Arizona’s 2.5% flat rate yields ~$7,500 — a delta of ~$19,500–$24,500/year.
At a $1,180,000 assessed value, the property tax delta alone is roughly ~$2,478/year versus a California-average effective rate comparison. Combined with the $300K income-tax delta, total annual tax savings often land around ~$22,000–$27,000/year. Over 10 years, that’s ~$220,000–$270,000 — frequently exceeding the retained cash position many buyers have after closing at Scottsdale’s median.
| Tax Category | California | Arizona / Maricopa County |
|---|---|---|
| Top State Income Tax Rate | 13.3% (+ 1.1% surcharge) | 2.5% flat |
| Effective Property Tax Rate | ~0.73% | ~0.52% |
| Avg Combined Sales Tax | 8.82% | 8.40% |
| Property Tax on $1,180,000 Home | ~$8,614/yr (CA equiv.) | ~$6,136/yr |
| State Income Tax on $300K AGI | ~$27,000–$32,000/yr | ~$7,500/yr |
| State Income Tax on $200K AGI | ~$15,000–$18,000/yr | ~$5,000/yr |
Sources: Tax Foundation (2025); Maricopa County Treasurer; California Franchise Tax Board.
At 6.5%, 30-year fixed, 20% down, estimated P&I on a $1,180,000 Scottsdale purchase is ~$5,965/month. Add Maricopa property tax (~$511/month) and HOA fees (often ~$100–$250/month in master-planned communities) and total monthly housing cost commonly models around ~$6,580–$6,730/month.
Correct framing: LA sellers buying at Scottsdale’s median often increase their mortgage obligation because Scottsdale’s median exceeds LA’s median. That’s why LA sellers are typically directed to Scottsdale’s entry tier ($700K–$850K), where payments often drop into a lower band.
Bay Area sellers see minimal mortgage delta at comparable price points; Scottsdale’s case is primarily product value per dollar plus income tax savings. San Jose sellers capture both levers: mortgage reduction plus income tax reduction.
Estimated combined first-year financial improvement for a San Jose household earning ~$300,000 purchasing at the Scottsdale median: mortgage delta (~$19,344/yr) plus AZ income tax savings (~$19,500–$24,500/yr).

| Origin | CA Median | CA Monthly P&I (6.5%, 20% dn) | Scottsdale $1.18M Monthly P&I | Monthly Delta |
|---|---|---|---|---|
| Los Angeles County | $890,910 | ~$4,501 | ~$5,965 | –$1,464 (higher) |
| SF / Bay Area | ~$1,200,000 | ~$6,062 | ~$5,965 | ~$97/mo |
| San Jose / Silicon Valley | ~$1,500,000 | ~$7,577 | ~$5,965 | ~$1,612/mo |
Sources: C.A.R. Dec 2025; FlexMLS Scottsdale 2025; mortgage math uses 6.5% 30-year fixed, 20% down, P&I only.
The longer average days on market versus East Valley mid-tier markets reflects Scottsdale’s luxury composition: higher price points, smaller buyer pool, longer decision timelines, and more frequent negotiation.
Population: ~258,000 residents (U.S. Census Bureau estimates). Scottsdale spans ~31 miles north–south, with major corridor variation in density and lot sizing.

| Metric | 2025 Figure | Year-over-Year Change |
|---|---|---|
| Median Sold Price (SF) | $1,180,000 | +4.0% |
| Average Sold Price (SF) | $1,574,838 | +3.0% |
| Average Price Per Sq Ft | $498 | +3.5% |
| Total Homes Sold (2025) | 4,146 | +7.2% |
| Average Days on Market | 84 days | +5 days |
Source: FlexMLS, Scottsdale single-family homes, 2025 full-year (as of January 5, 2026).
If net proceeds are below ~$900,000, Scottsdale’s entry tier is the access point — and Gilbert/Chandler typically produce materially higher retained equity at purchase. If net proceeds exceed ~$1.1M, Scottsdale’s mid and premium tiers become viable and the product-value case becomes dominant. At ~$1.4M+ proceeds, more of North Scottsdale opens and the income tax delta alone can be a major driver over a 10-year hold.
| Decision Factor | Scottsdale | Gilbert / Chandler |
|---|---|---|
| 2025 Median Price | $1,180,000 | $565,000–$592,250 |
| Price Per Sq Ft | ~$498 | ~$269–$297 |
| Primary CA Audience | Bay Area / San Jose ($1.2M–$1.5M+ sale) | LA / San Diego / Bay Area (all tiers) |
| Equity Retention Profile | Low-to-moderate at median; high via income tax delta | High cash retention across origin tiers |
| Days on Market | ~84 days | ~55–64 days |
Source: FlexMLS, Scottsdale single-family homes, 2025 full-year (as of January 5, 2026).