Portland’s median home sold for approximately $515,000 in late 2025. The Greater Phoenix median is $450,000. The price gap is narrower than California’s but the tax gap is not. Oregon stacks a 9.9% top state income tax on top of Metro-area surcharges that push total marginal rates past 12% for Portland earners. Arizona charges 2.5% flat. For a household earning $200,000, that difference is worth $10,000 to $14,000 per year and it compounds every year you stay.
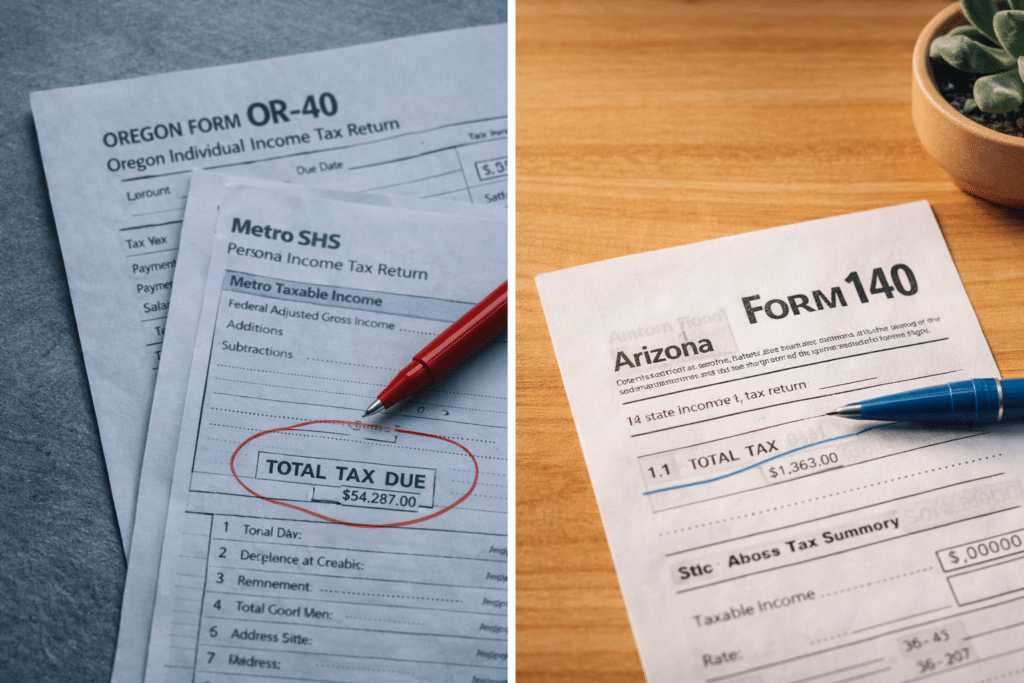
Oregon has one of the most complex income tax structures in the western United States and Portland amplifies it. At the state level, Oregon’s top marginal rate is 9.9%, applying to taxable income above $125,000 for single filers. Portland-area residents then face two additional income tax layers imposed by the Metro regional government and Multnomah County: the Metro Supportive Housing Services tax (1% on Metro taxable income above $125,000 for single filers and $200,000 for joint filers) and the Multnomah County Preschool for All tax (1.5% on county taxable income above the same thresholds). A dual-income Portland household earning $250,000 may carry a combined state and local marginal income tax rate approaching 12.4% before federal taxes enter the calculation.
Arizona’s answer: a 2.5% flat rate on all income, with no local income taxes layered on top. For a $200,000 household, that differential produces $10,000 to $14,000 in annual income tax savings and that figure rises as income grows. Over a decade, the cumulative delta compounds into six figures of capital that was previously flowing to Oregon’s tax authorities.
The property tax story adds another layer. Multnomah County’s effective property tax rate is approximately 1.07%, generating annual bills averaging over $5,000 on assessed value for Portland homeowners. Maricopa County’s effective rate is 0.52% generating roughly $2,600 on a $500,000 home. The annual property tax savings of $2,400 to $3,000 stack on top of the income tax reduction, creating a total annual tax recapture of $12,000 to $17,000 for a typical Portland household making the move.
And then there is Oregon’s estate tax one of the most consequential but least-discussed factors in the Portland-to-Arizona calculation. Oregon is one of only a handful of states that still levies a state estate tax, and it does so with the lowest exemption threshold in the nation: $1 million. Any estate exceeding that figure faces rates starting at 10% and climbing to 16% on amounts over $7.5 million. For Portland homeowners who have built equity over a decade-plus of appreciation, the combination of home value, retirement accounts, and other assets can easily breach the $1 million threshold. Arizona levies no estate tax. The wealth-transfer implication is significant for anyone with a long planning horizon.

Estimated annual state and local income tax savings for a Portland household earning $200,000, comparing Oregon’s layered tax structure to Arizona’s 2.5% flat rate.
Sources: Tax Foundation 2025; Oregon Department of Revenue; Portland.gov Revenue Division
Note on Oregon’s layered local income taxes: The Metro SHS tax (1%) and Multnomah County Preschool for All tax (1.5%) apply to Oregon taxable income above $125,000 for single filers and $200,000 for joint filers. Portland residents in Multnomah County who exceed these thresholds face a combined marginal state and local income tax rate of up to 12.4%. These are administered by the City of Portland Revenue Division and are in addition to Oregon’s state income tax.
Oregon’s estate tax is the critical long-game variable. The $1 million exemption threshold the lowest in the nation means a Portland homeowner with a paid-off or nearly paid-off home plus modest retirement savings may already be inside estate tax territory. Arizona has no estate tax. For households thinking about wealth transfer to the next generation, this asymmetry represents a compounding financial advantage to relocating.
Most Portland homeowners know Oregon has no sales tax — and that advantage is real. But the income and property tax differential more than offsets it, particularly for higher-earning households. Here is the full picture:
| Tax Category | Oregon (Portland Area) | Arizona (Maricopa Co.) |
|---|---|---|
| Top State Income Tax Rate | 9.9% (+ Metro 1% + County 1.5% for Portland earners) | 2.5% flat |
| Effective Property Tax Rate | ~1.07% (Multnomah County) | ~0.52% |
| State Sales Tax | 0% — No state sales tax | ~8.4% combined avg. |
| Estate / Inheritance Tax | Yes — 10%–16% above $1M threshold (lowest exemption in nation) | None |
| Social Security Tax | Not taxed at state level | Not taxed at state level |
| Annual Property Tax on $500K Home | ~$5,350 | ~$2,600 |
| Annual Income Tax on $200K AGI (Portland area) | ~$22,500–$31,200 (state + Metro + County) | ~$5,000 |
Sources: Tax Foundation 2025 State Income Tax Rates; Oregon Department of Revenue; Portland.gov Revenue Division; Oregon Legislative Revenue Office, Basic Facts 2025; Multnomah County property tax records; Maricopa County Treasurer
Oregon’s 9.9% top marginal income tax is the headline number and it is already one of the highest top rates in the nation. But Portland-area residents carry an additional burden that most income tax comparisons omit: a layered system of Metro-level and county-level income taxes that applies to income above specific thresholds. For a Portland resident in Multnomah County, the combined state and local income tax structure looks like this:
| Tax Layer | Rate | Applies When |
|---|---|---|
| Oregon State Income Tax (top bracket) | 9.90% | Income above $125K (single) / $250K (joint) |
| Metro SHS Personal Income Tax | +1.00% | Metro taxable income above $125K (single) / $200K (joint) |
| Multnomah County Preschool for All Tax | +1.50% | County income above $125K (single) / $200K (joint) |
| Combined Maximum Marginal Rate | 12.40% | Portland / Multnomah County top-bracket earners |

Compare that to Arizona’s 2.5% flat rate with no local income taxes and the full extent of the differential becomes clear. For a dual-income Portland household in Multnomah County earning $300,000 combined, the Oregon state-and-local income tax burden at top brackets is roughly $30,000 or more. In Arizona, the same income generates approximately $7,500 in state income tax. The annual delta approaches $22,500 for a household at that income level.
This analysis excludes Oregon’s estate tax exposure the $1 million threshold, lowest in the nation which may be the most overlooked financial variable for Portland homeowners who have accumulated equity, retirement assets, and other wealth over time.
Source: Oregon Department of Revenue; Portland.gov Revenue Division; Oregon Legislative Revenue Office, Basic Facts 2025
The tax savings dominate the Portland-to-Phoenix math but the cost-of-living recalibration reinforces the case across multiple budget line items. According to BLS Consumer Expenditure data, the Portland-Vancouver metro’s overall cost of living runs roughly 15% to 20% above the national average. The Phoenix metro runs approximately 3% to 6% above average a fraction of the Portland premium.
Housing is the anchor variable. A household carrying a $3,000-per-month mortgage on a Portland home at $515,000 (at 6.5% with 20% down) could carry a comparable or larger home in Chandler or Mesa at roughly $2,500 to $2,800 per month. That monthly delta is modest compared to California-to-Arizona moves, but when layered on top of the tax savings, the annual recapture figure is substantial.
One variable that skews in Oregon’s favor: no state sales tax. Portland residents pay 0% sales tax on purchases; Arizona’s combined average is 8.4%. For households with high discretionary spending, this can partially offset some savings. Factor it in but recognize that it does not come close to offsetting $10,000 to $14,000 in annual income tax savings for a typical $200,000-earning household.

Oregon’s state and local sales tax rate a genuine cost-of-living advantage that must be factored into any honest Portland-to-Arizona comparison. Arizona’s combined average is 8.4%.
Summer cooling costs are the one budget line where Phoenix is clearly more expensive: expect electric bills of $250 to $400 per month from June through September in a typical single-family home. This is a real cost that should be modeled in any household budget comparison. For most households at this income level, it does not materially alter the overall calculus — but it should be anticipated and planned for.
Source: Tax Foundation 2025; Oregon Department of Revenue
Portland sellers at the median ($515,000) enter the Phoenix Valley with estimated net sale proceeds of approximately $470,000 to $485,000 after standard transaction costs. Here is the current destination landscape and what each community delivers:
The equity math for Portland sellers is different from California’s the absolute dollar gap between Portland and Phoenix is narrower. But that narrower gap comes with a significant physical upgrade: what $515,000 buys in Portland (often a 1,400-1,800 square foot home on a tight city lot) versus what it buys in Gilbert or Chandler (2,400-3,000 square feet on a quarter-acre lot in a master-planned community with HOA-managed pool and park infrastructure). The space arbitrage is material, even where the price arbitrage is modest.
Portland sellers who have equity well beyond the median those selling homes in the $700,000 to $1 million range in close-in neighborhoods find a dramatically wider set of Phoenix Valley options, with outright purchase possible in most non-Scottsdale communities and significant cash-out positions retained.


Portland proceeds cover a substantial down payment with a mortgage payment well below Portland equivalents. Master-planned HOA infrastructure, large-format lots, significantly more square footage than Portland equivalents at the same price.

Near-breakeven purchase possible from Portland proceeds with a modest mortgage. Tech corridor access, established grid neighborhoods.

Portland equity typically funds a 40%–50% down payment on North Scottsdale inventory. The Valley’s most premium community.

Portland proceeds approach or reach full purchase price range. Broad inventory from entry-level to established neighborhoods.
Price data: ARMLS, Phoenix REALTORS year-to-date 2025 reports. Scottsdale figure reflects first 10 months of 2025.
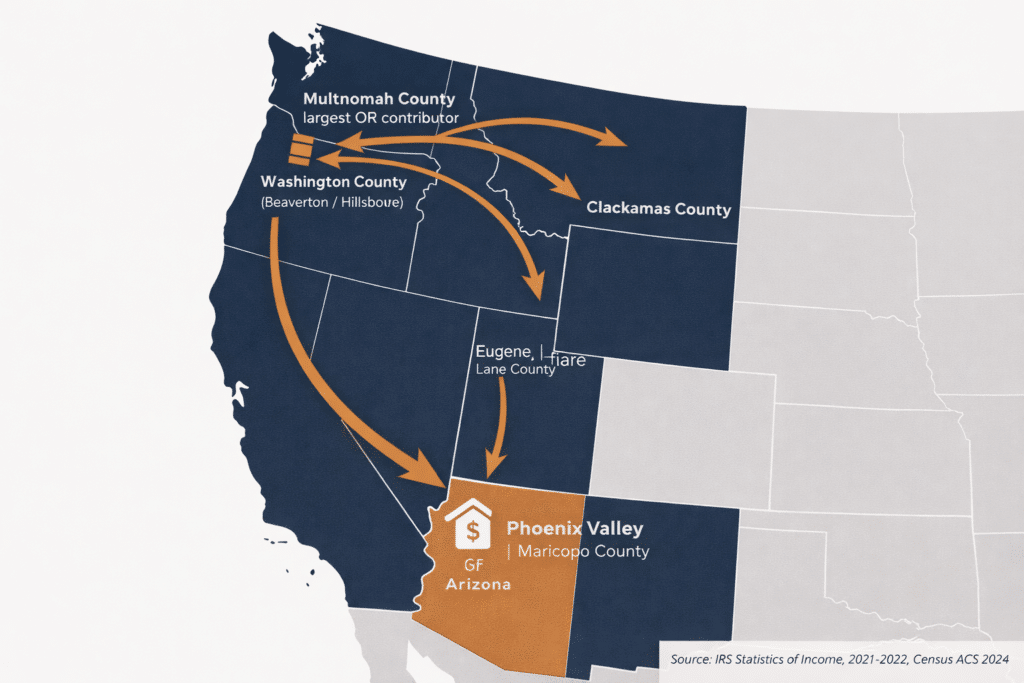
Oregon’s domestic migration trend has reversed sharply from its peak growth years. According to analysis by the Common Sense Institute Oregon using U.S. Census Bureau population estimates data, Oregon ranked 2nd nationally in migration attractiveness in 2016. By 2022, that ranking had fallen to 42nd. By 2023, it had reached 45th. In 2023, approximately 131,000 Oregon residents left the state through domestic migration, while only 125,000 arrived generating a net domestic migration loss.
IRS Statistics of Income data for the 2021–2022 filing year recorded 115,122 individual exemptions departing Oregon through domestic migration. The same dataset shows a critical pattern: Oregon experienced a net loss in total adjusted gross income from outmigration despite modest gains in raw return counts meaning the households leaving earned more, on average, than those arriving. This is consistent with financially motivated migration: homeowners with equity and income exposure to Oregon’s top tax brackets are the primary departure cohort.
Oregon’s domestic migration attractiveness ranking in 2023 down from 2nd in 2016. Oregon posted a net domestic migration loss in both 2022 and 2023.
Arizona is a primary beneficiary of this outflow. According to 2024 Census ACS 1-Year estimates, Arizona gained a net 55,505 residents from domestic migration, ranking 4th nationally. Research from the W.P. Carey School of Business at Arizona State University confirms that Arizona experienced its greatest net inflows from Oregon and Washington during 2021 and 2022 the same period that Oregon’s domestic migration decline accelerated. The Phoenix Valley specifically Maricopa County is the dominant landing point for Pacific Northwest migrants to Arizona.
Source: Common Sense Institute Oregon, analysis of U.S. Census Bureau population estimates data, 2024

| Oregon County | Estimated Migrants to AZ | Primary Destination |
|---|---|---|
| Multnomah County (Portland) | Largest single-county contributor | Maricopa County (Phoenix metro) |
| Washington County (Beaverton/Hillsboro) | Second-largest contributor | East Valley / Chandler corridor |
| Clackamas County (Lake Oswego/Tualatin) | Third contributor | Scottsdale / North Phoenix |
Source: IRS Statistics of Income, County-to-County Migration Data, 2021–2022; W.P. Carey School of Business / ASU CCPR, Migration to and from Arizona, October 2024
The income profile of Oregon’s outmigration matters for understanding who is making this move. IRS SOI data consistently shows that higher-income brackets account for disproportionate shares of outmigration from high-tax Pacific states. For Oregon, the $100,000 to $200,000 income bracket the precise range most exposed to the combined Oregon state, Metro, and County income tax layers is the cohort most actively engaged in the financial migration calculation.