The outdoor living infrastructure embedded in a standard Phoenix Valley home at $550,000 to $650,000 — inground pool, covered patio, desert-grade landscaping — carries a replacement cost of $75,000 to $110,000 or more when built from scratch. In King County, that asset class is largely inaccessible: lot constraints averaging 5,200 square feet for new construction metro-wide make meaningful outdoor infrastructure impractical, and construction economics in the Pacific Northwest do not favor the investment. This page quantifies the outdoor asset gap in dollar terms and explains why it represents a structural difference in what a King County home purchase produces versus what a Phoenix Valley purchase at a comparable price delivers.
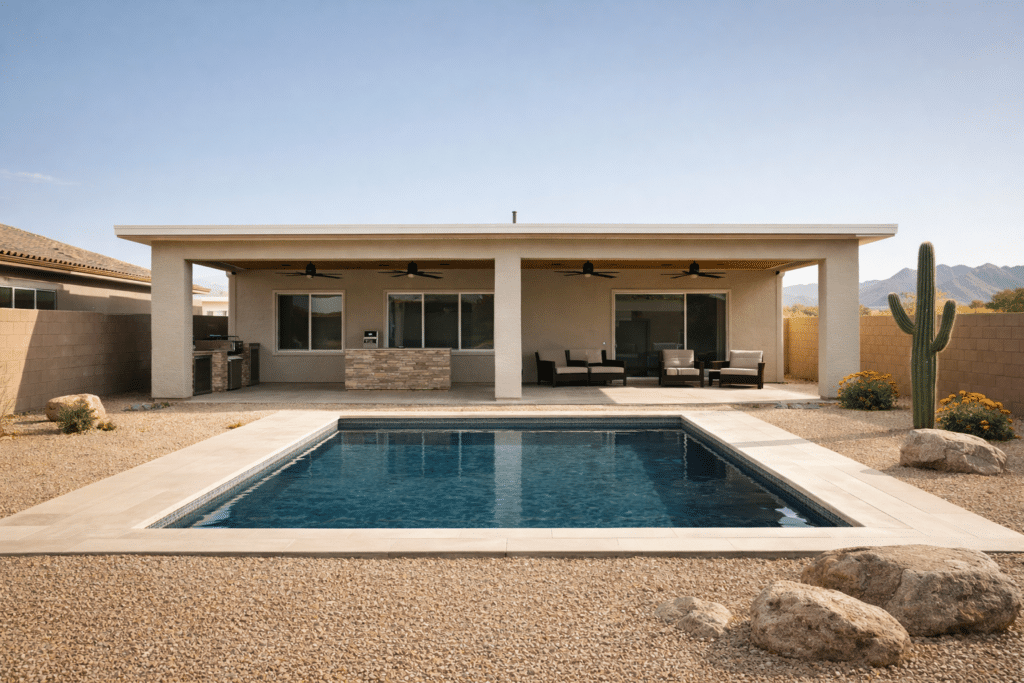
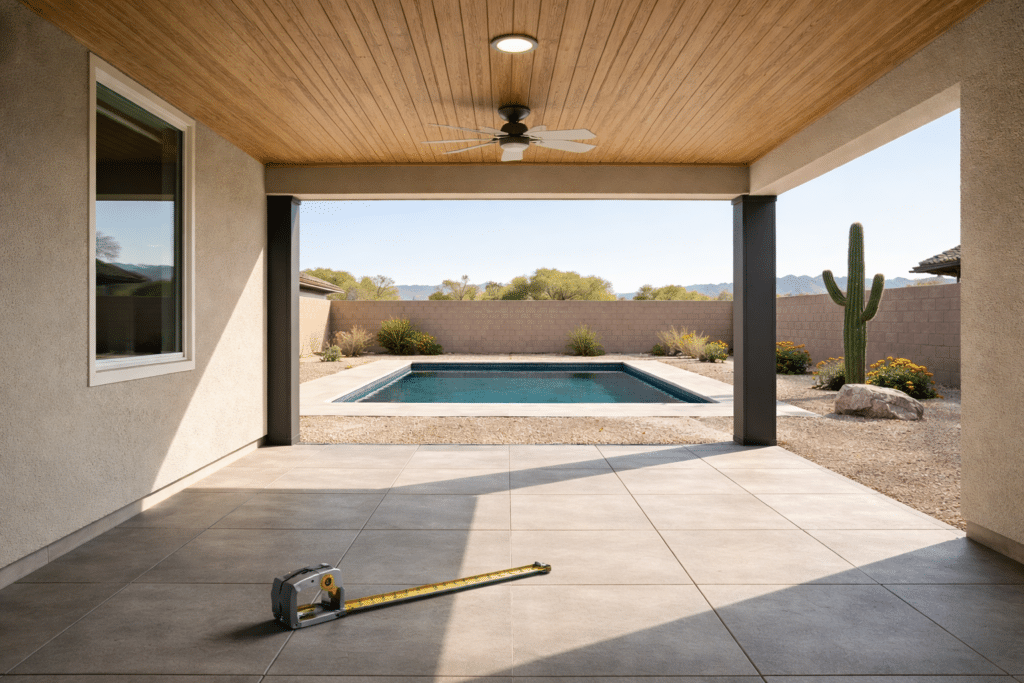
In the Phoenix Valley, a pool is not a luxury add-on that a buyer negotiates separately. It is a standard infrastructure feature embedded in the majority of homes in the $500,000 to $700,000 price range — appearing in approximately 60% to 75% of single-family listings in primary East and West Valley markets at that price tier, according to Phoenix REALTORS market data. When a King County seller purchases a Phoenix Valley home that includes an existing inground pool, covered rear patio, and professionally landscaped desert yard, they are not paying extra for those features. They are acquiring them as part of the purchase price — embedded capital that would cost $75,000 to $110,000 or more to build from scratch.
That embedded value does not exist in the King County market at scale. Pools are uncommon in King County single-family homes at any price tier. Angi’s pool cost data identifies Seattle as one of the cities in the United States with the fewest residential pools per capita — a function of lot constraints, construction economics, and the limited annual usability window that makes pool installation a poor return on investment in the Pacific Northwest. The result is a structural asymmetry: a King County home at $887,300 rarely includes outdoor infrastructure of quantifiable value. A Phoenix Valley home at $595,000 routinely does.
A concrete pool ($55,000–$70,000), a covered patio with a ceiling fan and electrical ($15,000–$25,000), and basic desert landscaping with decomposed granite, a palo verde, and perimeter planting ($8,000–$20,000) total an estimated $78,000 to $115,000 in construction cost at 2025 Phoenix-area contractor rates. When a Phoenix Valley home at $595,000 includes all three, the purchase represents a combined asset acquisition — not just a home, but the outdoor infrastructure that completes it. King County buyers arriving with $834,000 in estimated net proceeds from a median-priced sale have the capital to build this infrastructure from scratch if the home they purchase does not include it. The West Valley and East Valley destination pages detail what the purchase price delivers at each price tier.
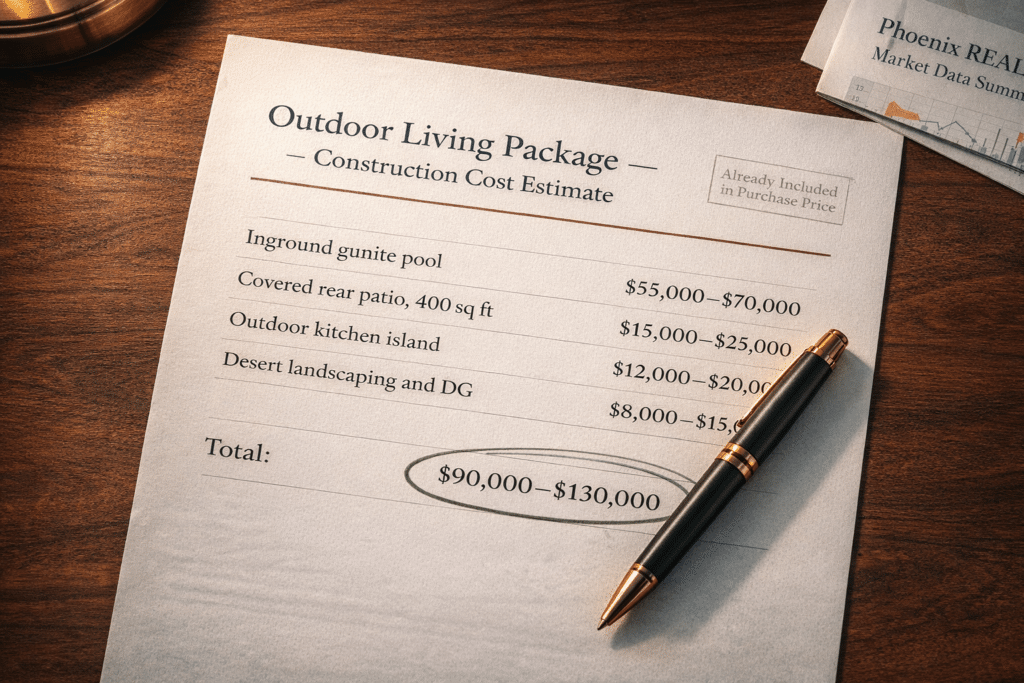
Estimated replacement cost of the outdoor living infrastructure — inground gunite pool, covered patio, desert landscaping — routinely embedded in a Phoenix Valley home in the $550,000–$650,000 price range.
Sources: Shasta Pools (2025), California Pools & Landscape (2025), contractor industry data; Phoenix Valley real estate market conditions, ARMLS/Phoenix REALTORS 2025
Estimated cost to build a mid-tier inground gunite/shotcrete pool in the Phoenix metro area in 2025, per Shasta Pools industry pricing data. Standard concrete pools range from $40,000 to $120,000 depending on size, features, and site conditions.
Source: Shasta Pools, 2025 Arizona Pool Cost Guide; California Pools & Landscape, 2025 Standard Pool pricing
Outdoor living infrastructure requires land area to exist. That is the physical constraint. King County’s ongoing densification has steadily reduced available land per residential unit. According to StorageCafe analysis of Property Shark data, the median lot size for newly built homes in the Seattle-Tacoma-Bellevue metropolitan area has declined from approximately 7,600 square feet in 2000 to approximately 5,200 square feet currently. Within the city of Seattle proper, the median new-build lot now stands at approximately 1,180 square feet — a 70% decline over two decades driven by townhouse construction and lot-splitting legislation. The practical consequence is not aesthetic — it is financial: on a 1,180-square-foot lot, there is no land budget for outdoor infrastructure of any meaningful scale.
Phoenix Valley lot sizes at comparable and lower price points tell a different story. In Surprise and Goodyear at the $430,000 to $475,000 median, standard single-family lots run 8,000 to 12,000 square feet. In Gilbert and Chandler at $565,000 to $595,000, lots of 7,500 to 10,000 square feet are common in master-planned inventory. In North Phoenix at $600,000 to $680,000, lots range from 7,000 to 10,000 square feet in newer builds and up to 14,000 square feet in select communities.
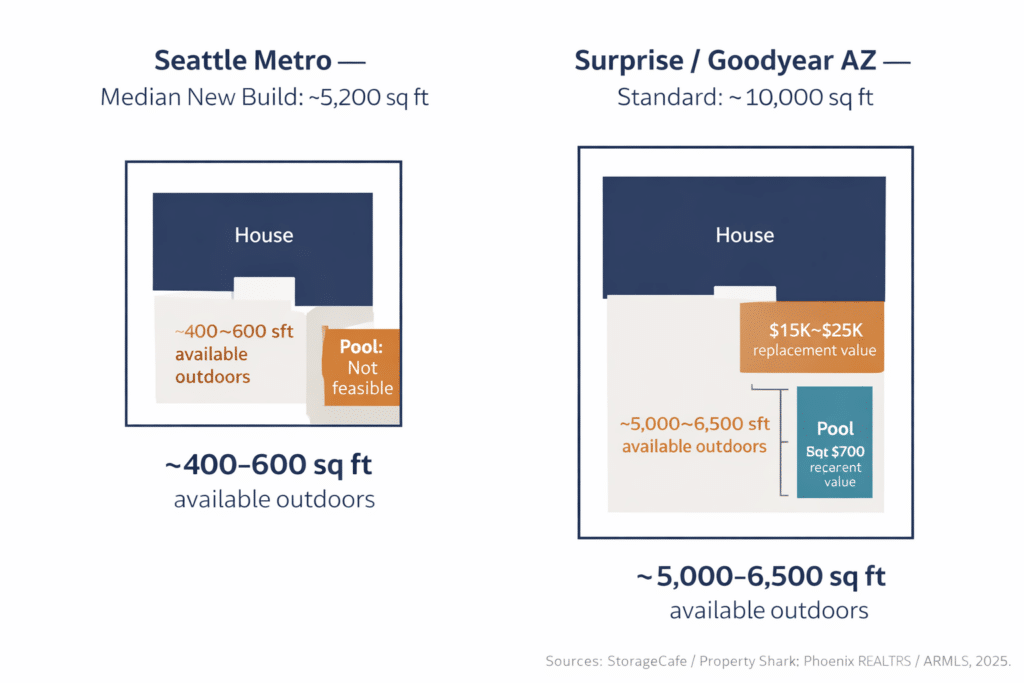
Median new-build lot size in the Seattle-Tacoma-Bellevue metro area versus standard single-family lot size in Surprise and Goodyear, Arizona, at the $430,000–$475,000 median price. The additional 2,800 to 6,800 square feet of land represents both outdoor buildable area and a per-square-foot land value differential.
Sources: StorageCafe analysis of Property Shark data (Seattle metro); Phoenix REALTORS / ARMLS West Valley market data, 2025
The land area differential — 3,000 to 7,000 additional square feet relative to a Seattle metro new-build — is itself a quantifiable asset. At a land value of $20 to $50 per square foot (a conservative estimate for West Valley residential land), 5,000 additional square feet represents $100,000 to $250,000 in raw land value embedded in the purchase price. That land area is also what makes the pool, covered patio, and landscaping physically possible.
| Market | Median Lot (New Build) | Buildable Outdoor Area | Pool Feasibility |
|---|---|---|---|
| Seattle (city proper) | ~1,180 sq ft | Minimal / none | Impractical |
| Seattle-Tacoma-Bellevue (metro) | ~5,200 sq ft | Limited | Uncommon |
| Surprise / Goodyear AZ | 8,000–12,000 sq ft | Substantial | Standard |
| Gilbert / Chandler AZ | 7,500–10,000 sq ft | Significant | Common |
| North Phoenix AZ | 7,000–10,000+ sq ft | Significant | Common |
Sources: StorageCafe / Property Shark Seattle metro data; Phoenix REALTORS / ARMLS 2025 submarket data
A King County homeowner who relocates to Phoenix and purchases a home without an outdoor living package faces a straightforward build-or-buy calculation. Inground pool construction in the Phoenix metro runs $55,000 to $80,000 for a mid-tier gunite/concrete pool at 2025 contractor pricing, according to Shasta Pools and California Pools & Landscape industry data. A covered patio with tongue-and-groove ceiling, ceiling fan, and electrical runs approximately $15,000 to $28,000. A basic outdoor kitchen island with gas grill, counter, and concrete block adds $12,000 to $25,000. Decomposed granite landscaping and desert planting for a 2,000-square-foot yard: $8,000 to $18,000. Total build-from-scratch cost for a complete outdoor package: approximately $90,000 to $151,000 in 2025 Phoenix-area contractor dollars.
In the Pacific Northwest, equivalent construction is possible but economically and structurally disadvantaged. In-ground pool installation in Washington ranges from $35,000 to $100,000, per Washington state pool industry data — comparable to Arizona at the low end, but the annual usability window that determines return on investment is a fraction of Phoenix’s. The result: King County pools are uncommon because the economic case for building one does not pencil at typical King County lot sizes and construction costs when set against the limited months of outdoor use. In Arizona, the economics of this infrastructure run in the opposite direction — the asset is common because the build economics and land availability make it rational, and as a result it is embedded in purchase prices at scale.
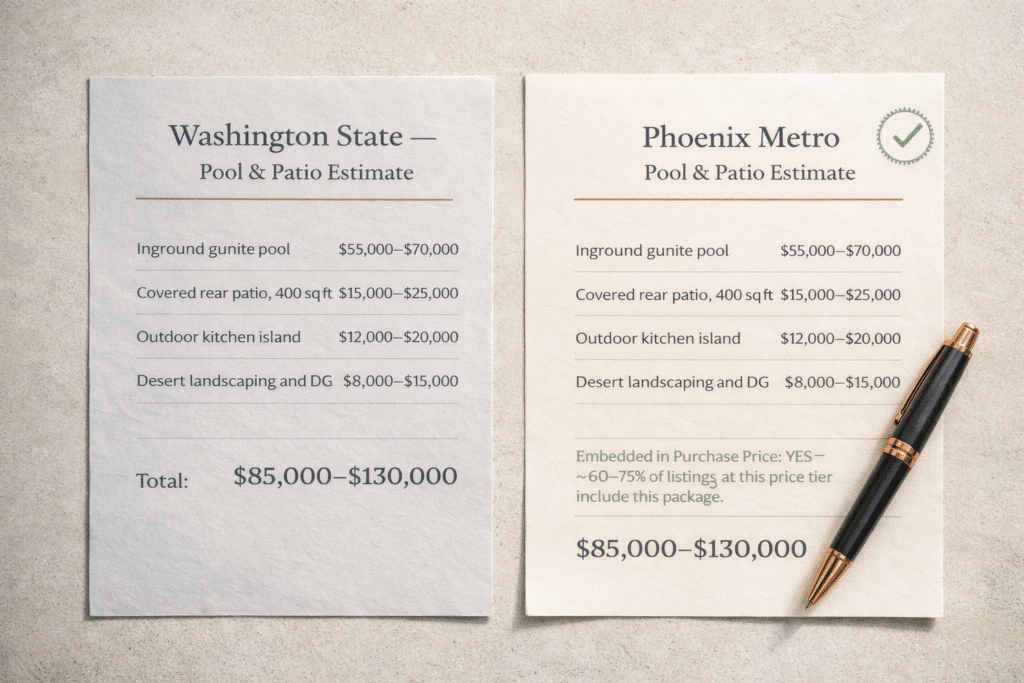
The key insight is not that construction costs differ dramatically — they do not, at the aggregate level. The key insight is market penetration: in Phoenix, outdoor living infrastructure is embedded in the purchase price because the economics of building it have made it rational to include it at time of construction. In King County, it is not embedded because lot constraints and limited usability have made it economically irrational to build. The King County buyer who relocates to Phoenix is not paying construction costs again — they are acquiring already-built infrastructure that the prior owner funded, at a purchase price that reflects it. That is the asset gap.
| Outdoor Asset | Arizona (2025 Contractor Est.) | Washington (2025) |
|---|---|---|
| Inground gunite pool | $55,000–$80,000 | $40,000–$100,000 |
| Covered patio (300 sq ft) | $15,000–$28,000 | $18,000–$35,000 |
| Outdoor kitchen island | $12,000–$25,000 | $15,000–$30,000 |
| Desert / yard landscaping | $8,000–$18,000 | $10,000–$22,000 |
| Total build estimate | ~$90,000–$151,000 | ~$83,000–$187,000 |
| Frequency embedded in purchase at $550K–$650K | Common (~60–75% of listings) | Rare |
Sources: Shasta Pools 2025 Arizona Pool Cost Guide; California Pools & Landscape 2025 pricing; Aqua Spas and Pools Pacific Northwest pool cost data; Phoenix REALTORS market data, 2025. Washington figures sourced from Washington state pool industry reporting.
Outdoor living infrastructure is not just a cost center in Phoenix — it is a documented value-add in the resale market. The National Association of Realtors (NAR) Cost vs. Value data and Phoenix-area transaction data consistently show that pools and covered patios in the Phoenix Valley deliver meaningful impact on days-on-market and closing price relative to comparable homes without them. Buyers in the $500,000 to $750,000 price tier in the Phoenix Valley market assign measurable premium to pool-included inventory — a premium that does not exist at scale in King County because the asset base is so uncommon.
The practical implication for a King County seller purchasing in the Phoenix Valley: homes with outdoor infrastructure in this price range tend to move faster and at tighter discounts to list price than equivalent square footage without it. A buyer who purchases a home with a pool and covered patio at $595,000 is not just acquiring a recreational feature — they are purchasing into the market-standard asset profile for the price tier. When they eventually sell, they will price and market the home against the same pool-included inventory set. The embedded infrastructure is a resale asset, not just a current-use asset.
Estimated share of Phoenix Valley single-family homes in the $550,000–$650,000 price range that include an existing inground pool, per Phoenix REALTORS market data. This high penetration rate is what makes pool-included inventory the market standard rather than the premium exception at this price tier.
Source: Phoenix REALTORS market data, 2025; ARMLS listing data
A covered patio is square footage. A 400-square-foot covered rear patio — standard in Phoenix Valley new construction — represents 8% to 15% additional functional area on a 2,600-to-5,000-square-foot home. It is not counted in the listed square footage of the home, but it functions as an extension of the living area and is assessed as such by appraisers evaluating covered, finished outdoor spaces.
In King County, a comparable outdoor structure would require a permit, a lot size that allows the setback requirements, and a construction budget. The typical King County lot in the Seattle metro at 5,200 square feet often cannot accommodate a 400-square-foot covered structure while meeting city setback requirements — particularly in jurisdictions where the minimum setback from property lines can consume the available rear yard. The space simply does not exist in the ground.
A Phoenix Valley lot at 9,000 square feet with a 2,800-square-foot home footprint has approximately 6,200 square feet of remaining land area to work with. A 400-square-foot covered patio at the back of the home consumes less than 7% of the available outdoor land area. This is why the asset exists at scale in Phoenix: the land budget accommodates it. In King County, the land budget increasingly does not.
Washington state’s 16,600 annual Arizona-bound tax filers — the second-largest state-to-state migration corridor into Arizona in IRS Statistics of Income 2021–2022 data — are not making an undifferentiated financial decision. The income bracket data within IRS SOI migration records shows that Washington-origin migrants skew toward the $100,000 to $200,000+ adjusted gross income tiers — homeowners with accumulated equity making structured financial choices. The outdoor living asset gap documented on this page is one component of those choices, alongside the equity gap, the property tax differential, and the cost-of-living arbitrage addressed on the Seattle pillar page and its companion financial guides.
The asset logic of the outdoor living upgrade is not abstract. A King County seller arriving in the Phoenix Valley with $834,000 in estimated net proceeds from a median-priced sale has the capital to purchase a home at $595,000 (Gilbert or Chandler), retain approximately $225,000 to $255,000 in net cash, and acquire outdoor infrastructure — pool, covered patio, desert landscaping — with a combined replacement cost of $78,000 to $115,000. The total package: a larger home, a more complete asset, and a six-figure cash reserve. That is what the migration numbers reflect in aggregate.
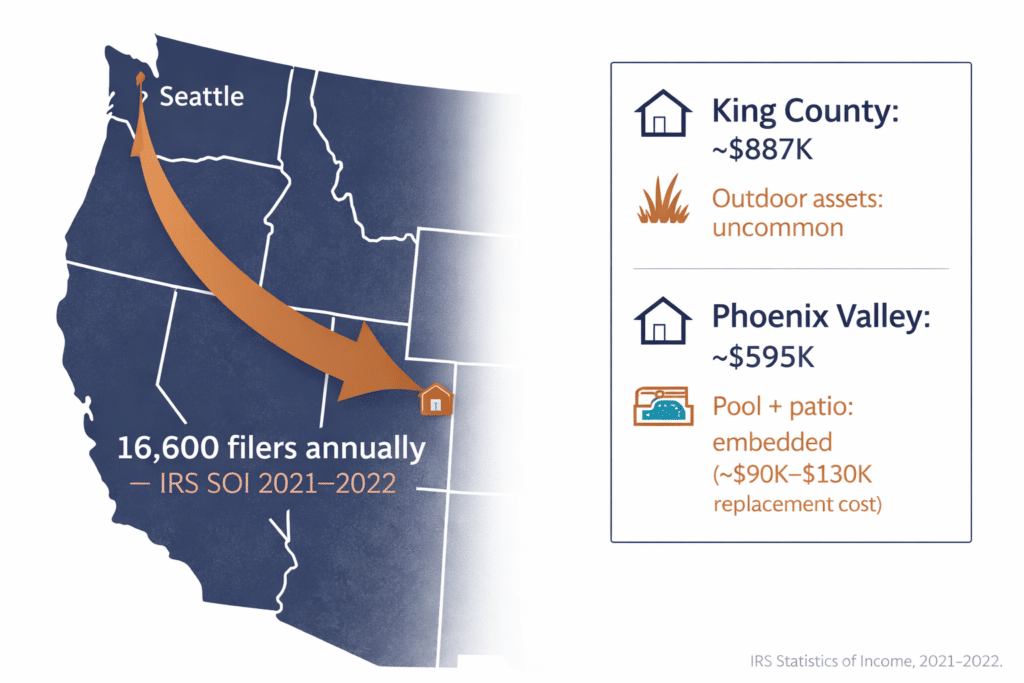
Washington state residents relocated to Arizona in the 2021–2022 IRS filing year — Washington is the second-largest origin state for Arizona-bound migration.
Source: IRS Statistics of Income, State-to-State Migration Data, 2021–2022