Three federal data sources — IRS Statistics of Income, U.S. Census Bureau population estimates, and USPS Change-of-Address records — independently confirm a sustained, multi-year capital flow from West Coast markets into the Phoenix Valley. This page assembles those numbers in one place, with the financial logic that explains the pattern.
This is not a page about why people move. It is a page about what the data says about what has happened — and what it implies for a homeowner sitting on California, Washington, or Oregon equity who is running their own numbers.
The three authoritative data sources used here are all government or government-adjacent sources:
The IRS Statistics of Income Division (SOI) publishes state-to-state and county-to-county migration data based on year-to-year address changes on individual tax returns. Because the data captures adjusted gross income (AGI) as well as household counts, it is the only federal source that simultaneously tracks how many households moved and what financial resources those moves represented. The most recently published dataset covers filing year 2021–2022.
The U.S. Census Bureau Population Estimates Program produces annual county- level population estimates incorporating births, deaths, and both domestic and international migration. These estimates provide the most comprehensive denominator for understanding growth patterns in Maricopa County relative to the rest of the United States.
USPS Change-of-Address records capture net mail forwarding directionality between ZIP codes. While they do not capture income information, they corroborate the directional migration signal from the IRS and Census data with near-real-time address-change confirmation.
Where these three sources converge on the same directional conclusion — as they do here — the signal is statistically robust. Individual motivations for relocation vary. The aggregate financial pattern documented by these sources does not.
DATA METHODOLOGY NOTE All figures on this page cite only the original government source and publication date. No migration data on this page is sourced from or attributed to Zillow, Redfin, or any competitor real estate platform. This page complies with Coastal to Cactus approved source standards (Section 03 of project operating standards).
IRS SOI
IRS SOI
U.S. Census Bureau
The IRS Statistics of Income Division migration data carries a distinction that no other migration dataset can match: it records the adjusted gross income of migrating households, not just their headcount. This makes it the authoritative source for understanding the financial character of migration — not simply its volume.
For filing year 2021–2022 (the most recently published IRS SOI state migration dataset), the data show:
California outbound: The state posted a net loss of 143,594 households, who carried with them a combined adjusted gross income of approximately $23.8 billion. (Source: IRS SOI 2021–2022; Center for Jobs analysis, June 2024.)
California lost a net 144,203 individual tax filers to interstate migration during the same period — the largest net outbound state in the nation. (Source: Tax Foundation analysis of IRS SOI data, December 2024.)
Among high-income filers (AGI of $200,000 or more), California recorded a net loss of 24,670 households, representing a combined AGI reduction of approximately $16.1 billion. (Source: Tax Foundation analysis of IRS SOI data, December 2024.)
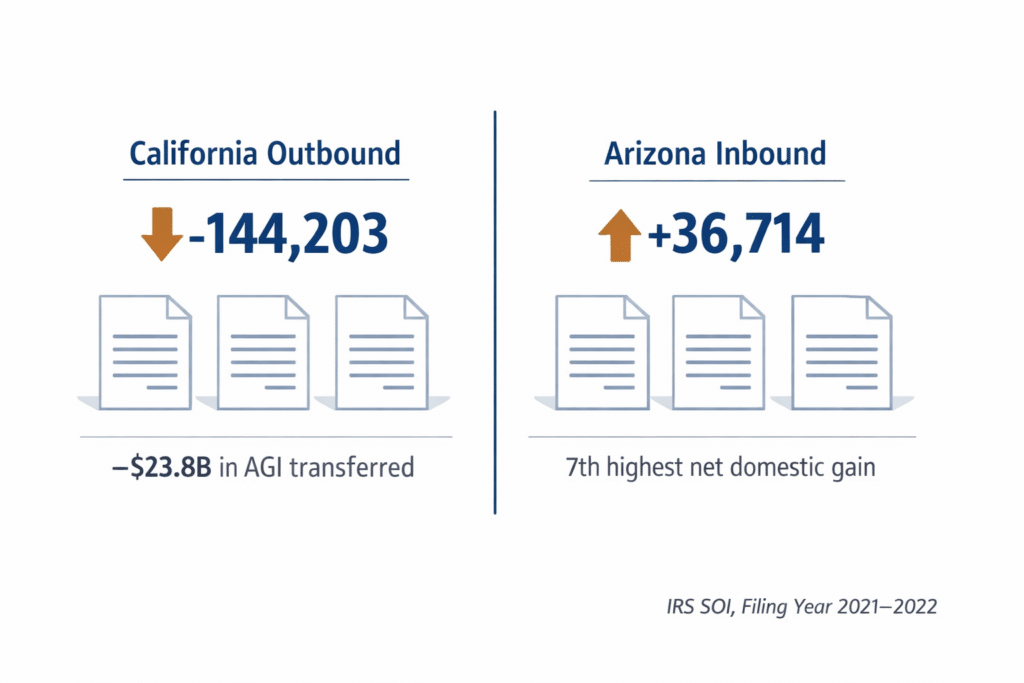
Arizona inbound: Arizona attracted approximately 223,000 domestic in-migrants in 2022, representing 3.2% of all domestic migration nationwide. Net domestic migration for Arizona totaled +36,714 persons — the seventh highest net gain of any state. (Source: IRS SOI 2021–2022; EBRC Arizona’s Economy analysis, November 2024.)
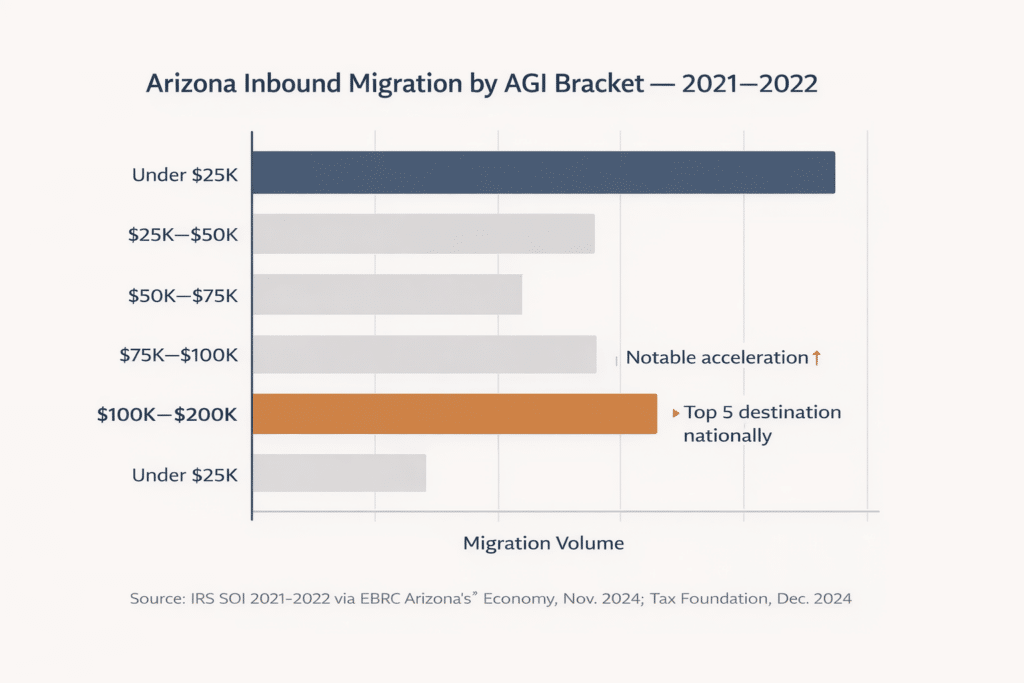
Among taxpayers with AGI of $200,000 or more, Arizona ranked among the top destination states nationally. (Source: Tax Foundation, December 2024.)
Among all income brackets, EBRC analysis of the IRS data identifies a notable acceleration in the $100,000–$200,000 AGI range for inbound Arizona migration — consistent with the equity-holding homeowner profile central to this platform’s audience. (Source: EBRC / Arizona’s Economy, November 2024.)
| State | Net Filer Change (Interstate) | AGI Transferred ($B, net loss) | Destination Rank (Outbound) States |
|---|---|---|---|
| California | –144,203 | –$23.8B | TX, AZ, NV |
| New York | –108,586 | n/a (TF) | FL, NJ, CT |
| Illinois | –45,460 | n/a (TF) | FL, TX, IN |
| Arizona | +Net gain (7th highest) |
Net AGI gain documented | Inbound: CA, WA, CO, TX |
| Florida | +125,551 | +AGI (largest) | n/a |
| Texas | +88,216 | +AGI | n/a |
Source: IRS Statistics of Income Division, Filing Year 2021–2022 State Migration Data. Tax Foundation analysis, December 2024. Center for Jobs high-earner analysis, June 2024. EBRC Arizona’s Economy, November 2024. Note: “n/a” indicates figure not independently verified to IRS primary source for this table. Values cited are from Tax Foundation analysis of IRS data, confirmed against IRS SOI publication.
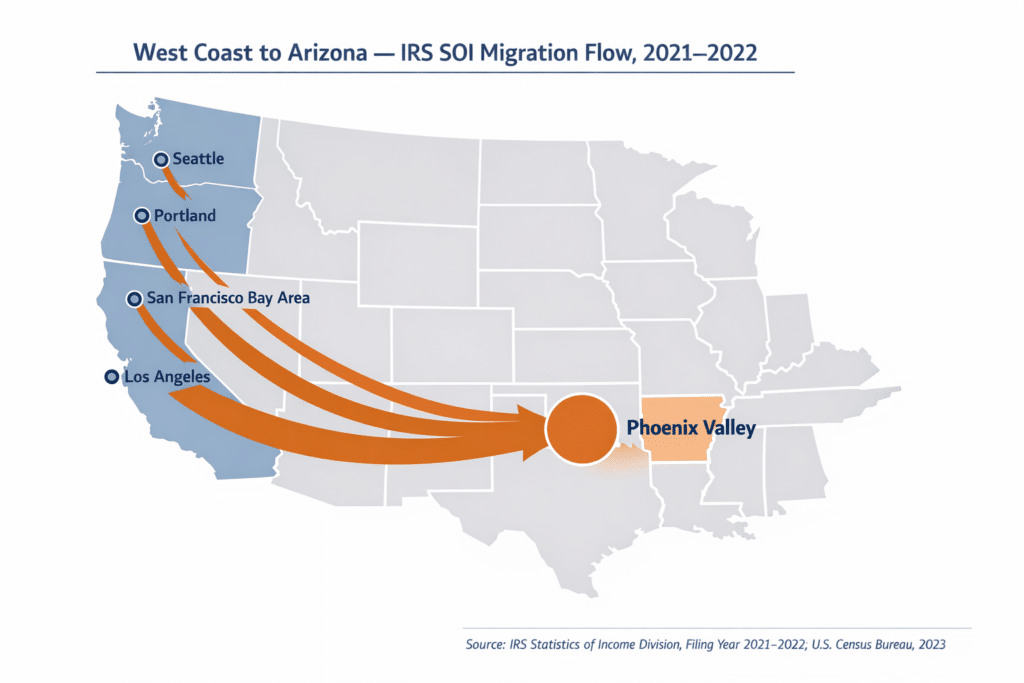
The Coastal to Cactus platform targets homeowners from California, Washington, Oregon, and the Inland Empire. Here is what the IRS SOI 2021–2022 data — the most recently published federal migration dataset — shows about each origin state’s outbound financial position relative to Arizona.

CALIFORNIA Net filer loss (2021–2022): –144,203 Net household loss: –143,594 Net AGI outflow: –$23.8 billion Top 3 destinations (outbound): Texas, Arizona, Nevada High-income filer loss ($200K+ AGI): –24,670 households / –$16.1B AGI Source: IRS SOI 2021–2022; Tax Foundation, December 2024; Center for Jobs, June 2024.
At the county level, Los Angeles County recorded a net domestic out- migration of –142,953 persons between 2021 and 2022, the largest single- county domestic outflow in the United States for that period. (Source: U.S. Census Bureau Population Estimates, March 2023.)
Maricopa County received more inbound households from California than from any other single state during this period, according to data from the Maricopa Association of Governments, corroborating the IRS state- level flow.
WASHINGTON STATE Net filer position (2021–2022): Net gain in tax returns Net AGI position: Net loss — outbound filers carried higher average AGI than inbound filers Source: IRS SOI 2021–2022; Tax Foundation, December 2024.
King County (Seattle) recorded net domestic out-migration of –16,035 persons between 2021 and 2022, a significant improvement from –37,655 the prior year but still a net outbound county. (Source: U.S. Census Bureau Population Estimates, March 2023.)
The financial profile of Washington outmigration is notable: the income of departing households exceeded that of arriving households on a per- return basis. This AGI reversal — a state gaining households but losing income-weighted capital — is the signature pattern of a high-tax origin market experiencing selective outmigration of higher-income filers.
OREGON Net individual outflow (2021–2022): –6,896 persons Net individuals to Arizona: 6,190 Oregon residents departed for Arizona California was the largest inbound Oregon origin (30,421 arrivals from CA) Source: IRS SOI 2021–2022; QualityInfo / Oregon Employment Department analysis, 2023.
Oregon, like Washington, saw a gain in tax returns filed but a net loss in AGI associated with those returns — indicating that higher-income filers were disproportionately represented among those leaving relative to those arriving. (Source: Tax Foundation, December 2024.)
Among Oregon outbound residents tracked by IRS data, Arizona was the third-most common destination state (6,190 individuals), behind Washington (25,470) and California (15,806), and roughly equal to Texas (9,108).
The IRS data tracks financial flows. The Census Bureau Population Estimates Program tracks people. On Maricopa County specifically, both datasets point in the same direction — and have for more than a decade.
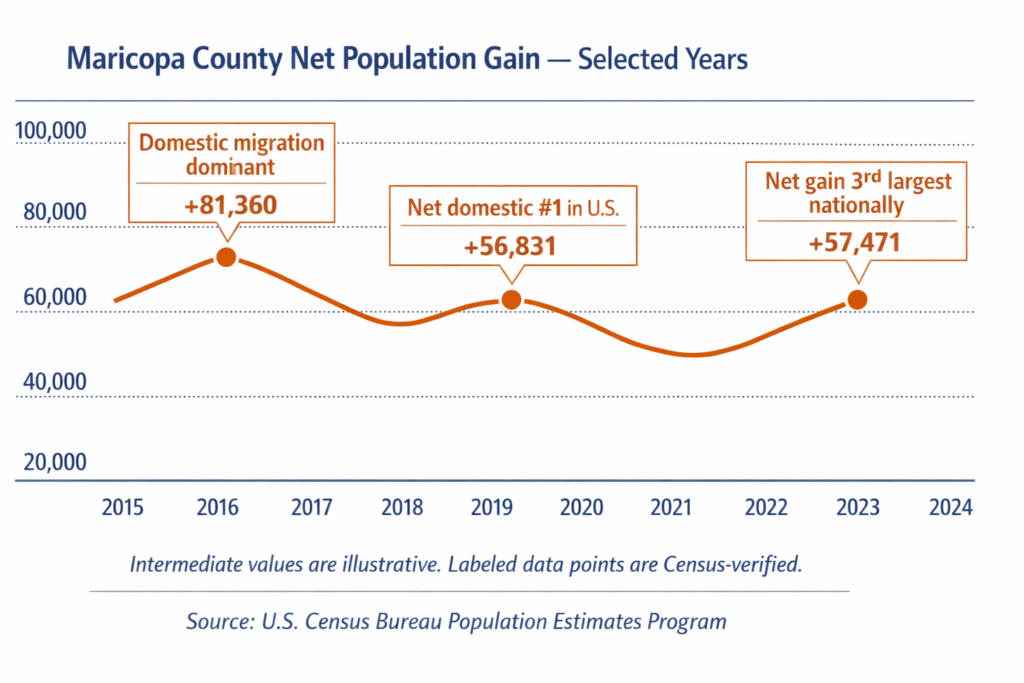
2021–2022 Period: Maricopa County was the #1 largest-gaining county in the United States, adding 56,831 residents between July 1, 2021 and July 1, 2022. Domestic migration — people moving into Maricopa County from other parts of the United States — was identified as the primary component of this growth, ahead of natural increase (births minus deaths) and international migration. Of the top net domestic migration leaders among large counties, Maricopa County ranked first at +33,305 net domestic migrants. (Source: U.S. Census Bureau Population Estimates, March 2023.)
Los Angeles County, California, had the largest population decline in the United States during the same period, down –90,704 residents. (Source: U.S. Census Bureau Population Estimates, March 2023.)
2023–2024 Period (Vintage 2024 Estimates): Maricopa County was the third-largest-gaining county in the nation between July 1, 2023 and July 1, 2024, adding 57,471 residents — averaging 173 new residents every single day of the year. Only Harris County, Texas (+105,852) and Miami-Dade County, Florida (+64,211) posted larger numeric gains. (Source: U.S. Census Bureau Vintage 2024 Population Estimates, released March 2025.)
As of July 1, 2024, Maricopa County’s total population reached 4,673,096 — the fourth most-populous county in the United States. (Source: U.S. Census Bureau Vintage 2024.)
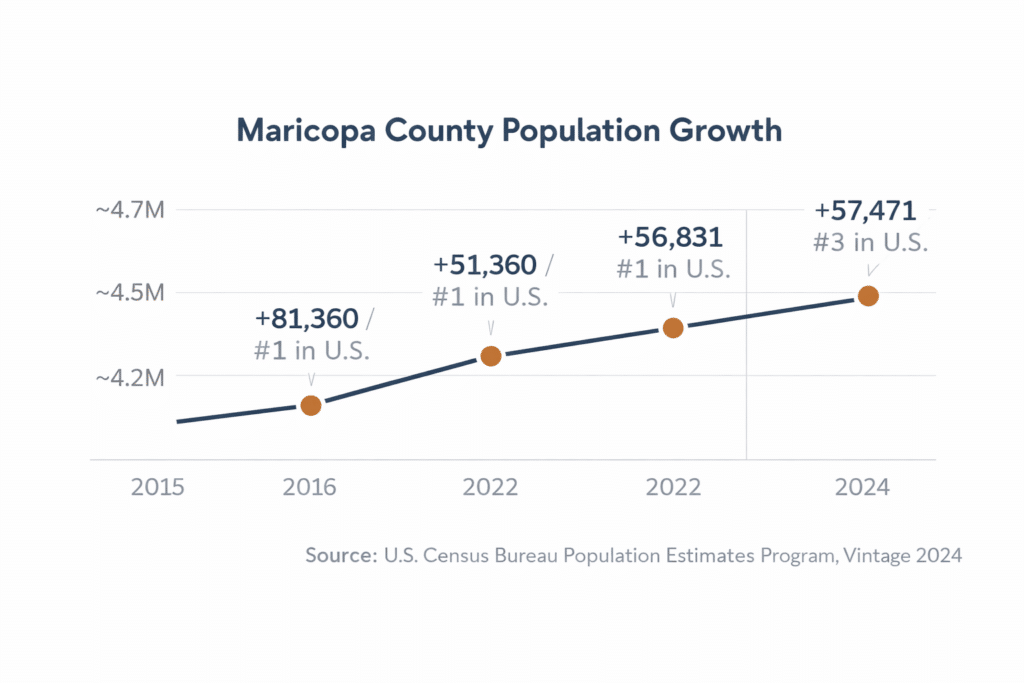
Long-run context: Maricopa County’s population has grown approximately 25% since 2010, from 3,825,183 to an estimated 4.7M+ as of 2024. Domestic migration has been the dominant driver of growth throughout this period — making Maricopa County’s trajectory one of the most sustained and documented domestic migration stories in contemporary U.S. geography.
Source: U.S. Census Bureau, 2023
Source: U.S. Census Bureau Vintage 2024, March 2025
Source: U.S. Census Bureau Vintage 2024
USPS Change-of-Address data tracks net mail forwarding between ZIP codes, providing the most frequently updated directional signal of household relocation across the country. Because it operates at the ZIP code level rather than the state level, it can detect migration corridor patterns at sub-regional granularity.
The pattern confirmed by USPS data for the California-to-Arizona corridor is consistent with the IRS and Census signals:
California has maintained a net negative Change-of-Address position — more households forwarding mail out of California than into it — across the 2020–2025 period. The aggregate net outflow from California ZIP codes exceeded 239,000 households in the most recently reported period, making California the largest net-outbound state in the nation by USPS forwarding records. (Source: USPS Change-of-Address Data, 2025 reporting period; Three Movers national migration trend analysis citing USPS data, September 2025.)
Arizona maintained a net positive Change-of-Address position throughout the same period. Allied Van Lines’ annual migration data independently confirmed Arizona as one of the most moved-to states for professional household moves in consecutive years (Allied Van Lines, published 2025 reporting period).
The USPS signal does not capture the income characteristics of migrating households — for that, the IRS SOI data is the authoritative source. What the USPS data provides is corroboration: independently of the tax return method, the mail forwarding method produces the same directional conclusion.
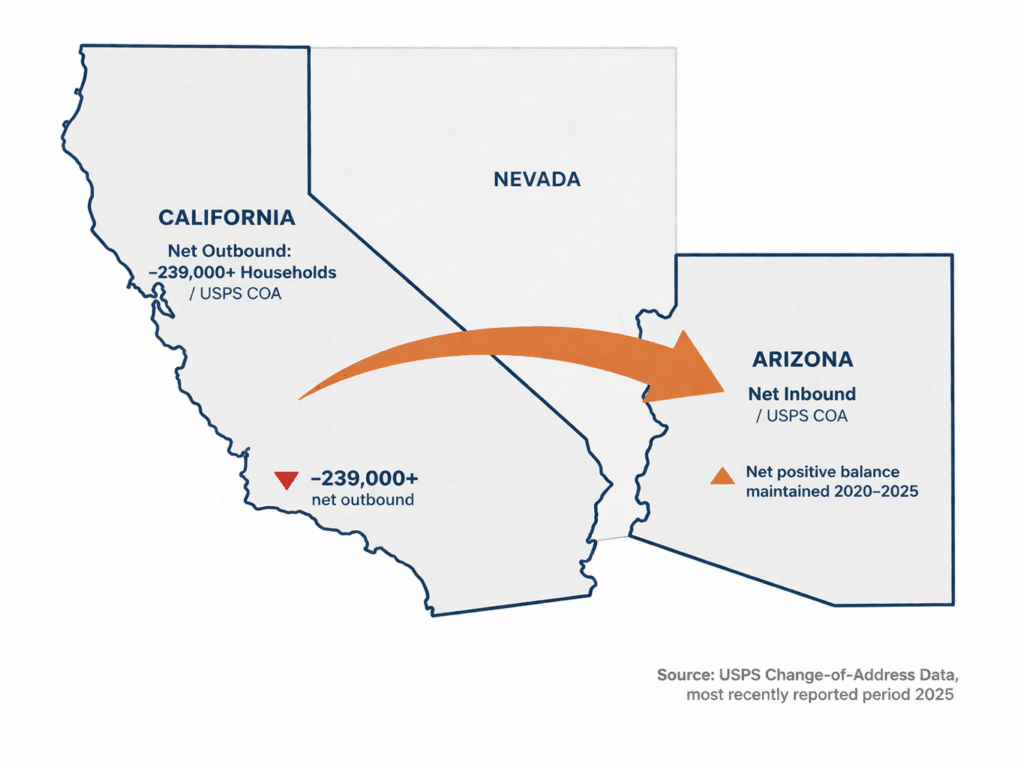
CALIFORNIA NET OUTBOUND USPS Change-of-Address Data –239,000+ net households More leaving than arriving Most recently reported period, 2025 Source: USPS Change-of-Address; cited in Three Movers national migration analysis, Sept. 2025
ARIZONA NET INBOUND Positive net Change-of-Address balance maintained 2020–2025 Allied Van Lines: Among top most moved-to states (2025)
Migration data, on its own, is a directional indicator — it tells you where households are going. What it does not tell you, by itself, is whether the financial terms of those moves made sense for the homeowners involved. That is the work of the equity calculation.
The IRS migration data becomes most useful for a relocating homeowner when it is read in combination with the home price differential data that underlies it. The acceleration in the $100,000–$200,000 AGI bracket for inbound Arizona migration — identified in EBRC’s analysis of IRS SOI data — correlates with the income profile of West Coast homeowners who have accumulated substantial equity in primary residences purchased before 2020.
These are households whose appreciated home equity represents a capital position that can be materially redeployed in a lower-cost destination market. The home price data confirms the math:
California statewide median: $850,680 (CAR, December 2025)
Los Angeles County median: $890,910 (CAR, December 2025)
Phoenix Valley metro median: $450,000 (ARMLS, December 2025)
Gross equity gap (LA County vs. AZ): $440,910
A homeowner selling at the Los Angeles County median and purchasing at the Phoenix Valley metro median eliminates the need for approximately $440,000 in new mortgage debt — or retains that capital as liquid equity. At current 30-year fixed rates (~6.5%), $440,000 in avoided debt represents a reduction in monthly principal and interest obligation of approximately $2,750–$2,900.
This is the financial logic that the migration data is measuring in aggregate.

Sources: CAR December 2025 Sales & Price Report; ARMLS December 2025 Market Report; Tax Foundation; IRS SOI 2021–2022.
The headline migration numbers — 144,203 net California filer loss, 36,714 net Arizona domestic gain — are useful for establishing the scale of the trend. But the income bracket breakdown is what makes this data actionable for a financial analysis of the homeowner relocation decision.
The IRS SOI data enables breakdown of migration flows by AGI size class. Analysis of the 2021–2022 data by EBRC (Economic and Business Research Center at the University of Arizona, published in Arizona’s Economy, November 2024) identified the following pattern for Arizona inbound migration:
Most common bracket by volume: $25,000–$50,000 AGI range
Notable acceleration bracket: $100,000–$200,000 AGI range
Premium tier: $200,000+ AGI — Arizona among top 5 destination states
The $100,000–$200,000 bracket acceleration is the financially significant data point for this platform’s audience. This income range approximates the household income profile of homeowners who purchased West Coast properties in the 2010–2018 period and have accumulated equity in the $400,000–$700,000 range on those properties — the core homeowner profile that the Coastal to Cactus equity arbitrage analysis addresses.
The $200,000+ bracket confirms that high-income households — those most likely to hold substantial real estate equity and to have the financial flexibility to execute a tax-efficient relocation — are disproportionately choosing Arizona as a destination relative to their share of the outbound California population.
California lost a net 24,670 high-earner households ($200K+ AGI) in 2021–2022, representing the exit of approximately $16.1 billion in AGI from California’s tax base. Arizona captured a meaningful share of that inbound high-income flow. (Source: Tax Foundation analysis, December 2024; IRS SOI 2021–2022.)
AGI BRACKET SNAPSHOT
Arizona Inbound Migration, 2021–2022
(IRS SOI Data / EBRC Analysis)
$25K–$50K: Highest volume bracket
$100K–$200K: Notable acceleration
$200K+: Top 5 destination nationally
California $200K+ net outflow:
–24,670 households / –$16.1B AGI
(Tax Foundation / IRS SOI 2021–2022)
The following table draws on U.S. Census Bureau Population Estimates and IRS SOI data to show the sustained nature of the Maricopa County growth story over multiple measurement periods. This is not a single-year anomaly — it is a durable, multi-source, multi-year pattern.
| Period | Net New Residents | Domestic Migration Component | National Rank (Numeric Growth) |
|---|---|---|---|
| July 2015–2016 | +81,360 | +43,189 domestic net migration | #1 in U.S. (Census, 2017) |
| July 2021–2022 | +56,831 | Domestic migration primary component Net domestic: +33,305 |
#1 in U.S. (Census, 2023) |
| July 2023–2024 | +57,471 (173/day) |
Combined domestic and international migration | #3 in U.S. (Census, March 2025) |
| Cumulative 2010–2024 | +25.17% since 2010 |
Domestic migration dominant driver over full period | 4th most-populous county nationally |
Sources: U.S. Census Bureau Population Estimates Program — Vintage 2024 (released March 2025); U.S. Census Bureau Press Release, March 2023 (2022 estimates); U.S. Census Bureau Press Release, March 2017 (2016 estimates). All data represent Census Bureau published estimates — not projections.
Three independent measurement periods spanning nine years (2015–2024) show Maricopa County’s population growth placing in the top three nationally in each measured interval. In two of three periods, domestic migration was the identified primary or dominant growth component.
This consistency across multiple Census vintages is not incidental. It reflects a sustained structural differential between Maricopa County’s cost of housing, tax burden, and total cost of occupancy relative to the origin markets generating the migration flows.
The 2024 period data introduced a notable shift: international migration played a larger role than in prior periods, contributing to the county’s third-place national ranking. Domestic migration as a sole driver was partially offset by this compositional shift. The underlying structural financial differential between West Coast housing costs and Phoenix Valley costs that drives domestic migration has not changed materially based on available 2025 ARMLS and CAR pricing data.
A1: According to IRS Statistics of Income Division data for filing year 2021–2022 (the most recently published dataset), California posted a net loss of 143,594 households, who carried with them approximately $23.8 billion in adjusted gross income. Arizona was among the top three destination states for California outbound households, alongside Texas and Nevada. (Source: IRS SOI 2021–2022; Center for Jobs, June 2024.)
A2: U.S. Census Bureau Vintage 2024 Population Estimates (released March 2025) show Maricopa County added 57,471 net residents between July 2023 and July 2024, making it the third-fastest growing county nationally. In the prior 2021–2022 period, Maricopa County was the #1 largest-gaining county in the United States, with domestic migration as the primary growth driver. (Source: U.S. Census Bureau, March 2025; March 2023.)
A3: IRS SOI data analyzed by EBRC (November 2024) and the Tax Foundation (December 2024) shows Arizona ranked among the top destination states for taxpayers with $200,000+ AGI. A notable acceleration in the $100,000– $200,000 AGI bracket was also identified — consistent with the equity- holding homeowner profile central to West Coast relocation patterns. (Source: IRS SOI 2021–2022; Tax Foundation; EBRC Arizona’s Economy.)
A4: Yes. IRS SOI state-level data covers Washington and Oregon. Washington saw a net gain in tax return headcount but a net loss in AGI — higher- income households leaving at a higher rate than those arriving. King County (Seattle) had net domestic out-migration of –16,035 in 2022. Oregon had a net individual loss of –6,896, with 6,190 departing for Arizona specifically. (Source: IRS SOI 2021–2022; Tax Foundation; U.S. Census Bureau 2023.)
A5: The IRS Statistics of Income Division publishes state-to-state and county-to-county migration data at irs.gov/statistics/soi-tax-stats- migration-data. The most recently published dataset as of Q1 2026 covers filing year 2021–2022. Data files are available for public download in CSV and Excel formats. The Tax Foundation publishes annual analysis of IRS SOI migration data at taxfoundation.org.

The migration data on this page documents the aggregate flow. The following pages apply that same financial logic to your specific origin market — with current pricing, tax comparisons, and equity calculations for each corridor.
Origin-Market Context: King County, WA Net domestic out-migration documented (Census 2022)
Origin-Market Context: Multnomah County, OR 6,190 Oregon residents moved to AZ in 2021–2022