Gilbert’s 2025 median sold price is $592,250. At $269 to $280 per square foot, that delivers approximately 2,100 to 2,200 square feet of newly built or near-new construction in a master-planned community with HOA infrastructure — community pools, parks, ramadas, and trail networks — on a lot that would not exist at this price in any California origin market. The equity retained after a median California sale and a median Gilbert purchase is not incidental. For most origin markets, it’s six figures.
The financial logic of the California-to-Gilbert move is straightforward arithmetic. You sell at your California market price, purchase at Gilbert’s median or above, account for transaction costs on both ends, and what remains is the equity you’ve unlocked — capital that was trapped in your California property and is now liquid or deployable against the new mortgage.
The table below applies this framework to four primary California origin markets, using current median pricing data from the California Association of Realtors (2025) and ARMLS/FlexMLS (2025). Transaction cost assumptions: 6% of California sale price; standard Arizona closing costs on the Gilbert purchase.
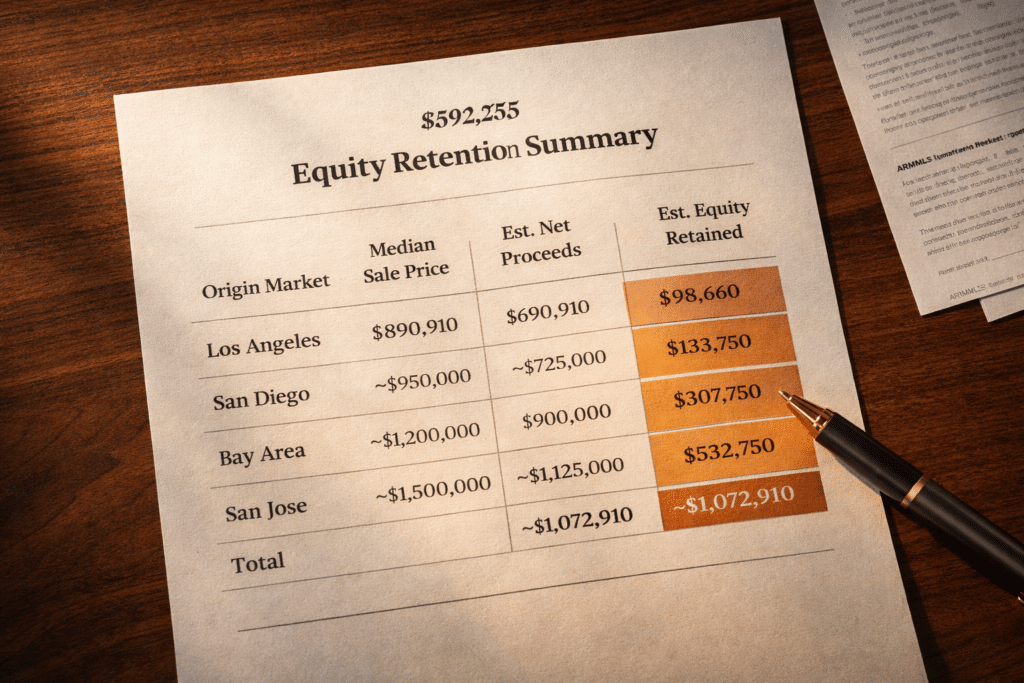
| Origin Market | CA Median Sale | Est. Net CA Proceeds | Gilbert Purchase | Est. Equity Retained |
|---|---|---|---|---|
| Los Angeles County | $890,910 | ~$837,000 | $592,250 | ~$240,000–$260,000 |
| San Diego County | ~$950,000 | ~$893,000 | $592,250 | ~$295,000–$315,000 |
| San Francisco / Bay Area | ~$1,200,000 | ~$1,128,000 | $592,250 | ~$520,000–$545,000 |
| San Jose / Silicon Valley | ~$1,500,000 | ~$1,410,000 | $592,250 | ~$800,000–$830,000 |
Sources: California Association of Realtors (2025); ARMLS / FlexMLS (2025 full-year). Net proceeds estimated after 6% transaction costs on CA sale. Arizona closing costs estimated using standard Maricopa County ranges. Estimates only; results vary by price, payoff, and terms.
Retained equity is not a paper gain. It is deployable capital. Sellers retaining $300,000 to $500,000 can apply it to reduce or eliminate a mortgage payment, invest it, renovate, or hold it as reserves that didn’t exist while equity was locked inside the California home.
Gilbert’s market data is consistent: priced above the Greater Phoenix median, well below California origin markets, with price-per-square-foot that translates into real physical space.

2025 Median Single-Family Sold Price
2025 Median Price Per Square Foot
Estimated Square Footage at Median Price
Median Days on Market
Effective Property Tax Rate (Maricopa County)
Estimated Annual Property Tax at Median Price
Greater Phoenix Median (context)
Price data: ARMLS, Phoenix REALTORS year-to-date 2025 reports. Equity retained estimates assume 6% transaction costs on the San Diego sale plus standard Phoenix closing costs. Results vary based on sale price, loan payoff, and negotiated terms.
Gilbert’s $592,250 median sits $142,250 above the $450,000 Greater Phoenix median. The premium is most visible in HOA-governed master-planned inventory and amenity infrastructure rather than a raw “city vs. city” comparison. For California buyers, the relevant comparison is Gilbert vs. the origin market.
At $592,250, Gilbert sits roughly $298,660 below the LA County median, ~$357,750 below the San Diego median, ~$607,750 below the Bay Area median, and ~$907,750 below the San Jose median.
Gilbert’s inventory segments clearly by price tier, and each tier produces a different physical product. Ranges below use the ARMLS/FlexMLS 2025 price-per-square-foot band ($269–$280) and represent typical single-family inventory patterns.
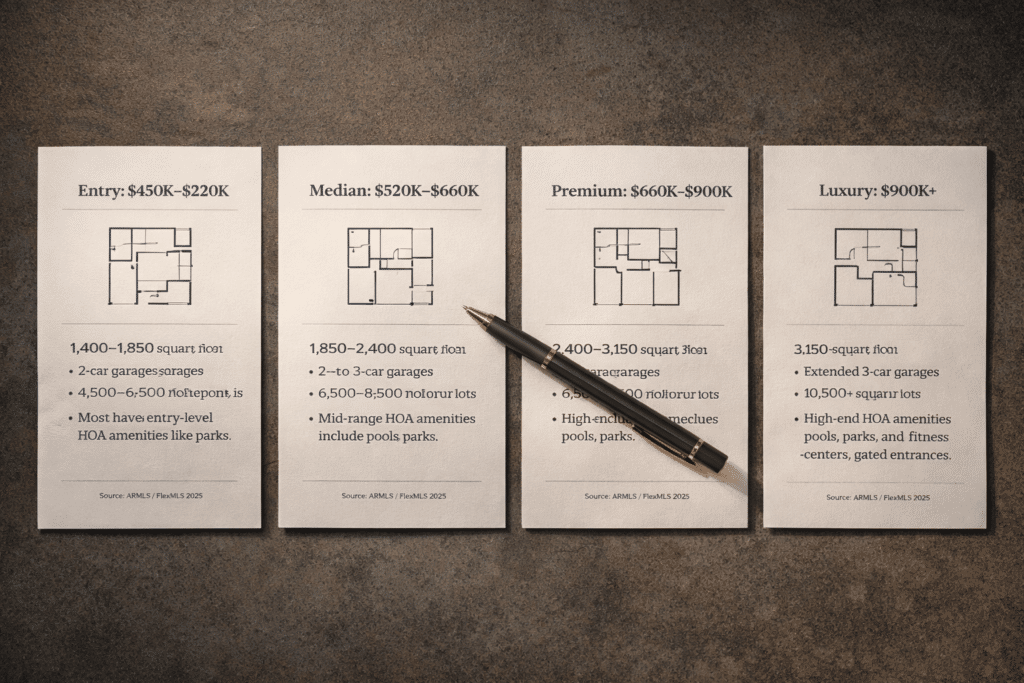
Buyers typically find single-story homes around 1,600–1,900 sq ft, often resale inventory from the 2000s–2010s. HOA governance and amenity access are common at this tier. For California sellers with $200,000–$300,000 of post-close equity, this tier allows for aggressive mortgage reduction.
Approximately 1,900–2,400 sq ft — the core of Gilbert’s master-planned single-family inventory. Three to four bedrooms, covered patios, two- to three-car garages, and lots often in the 6,000–9,000 sq ft range. New and near-new construction appears frequently in this band.
Roughly 2,400–3,300 sq ft, with larger lots (8,000–12,000+ sq ft in some communities), upgraded finishes, and occasional private pools. For Bay Area and Silicon Valley sellers retaining $500,000+, this tier still preserves substantial deployable capital post-close.
Often 3,500+ sq ft on larger lots (15,000 sq ft and up), with higher-end finishes and custom-build patterns. This tier is typically accessible for higher-end Bay Area and Silicon Valley sellers with significant retained equity after the California sale.
Square footage ranges are estimates derived from $269–$280/sq ft (ARMLS/FlexMLS 2025) and will vary by lot size, upgrades, and community.
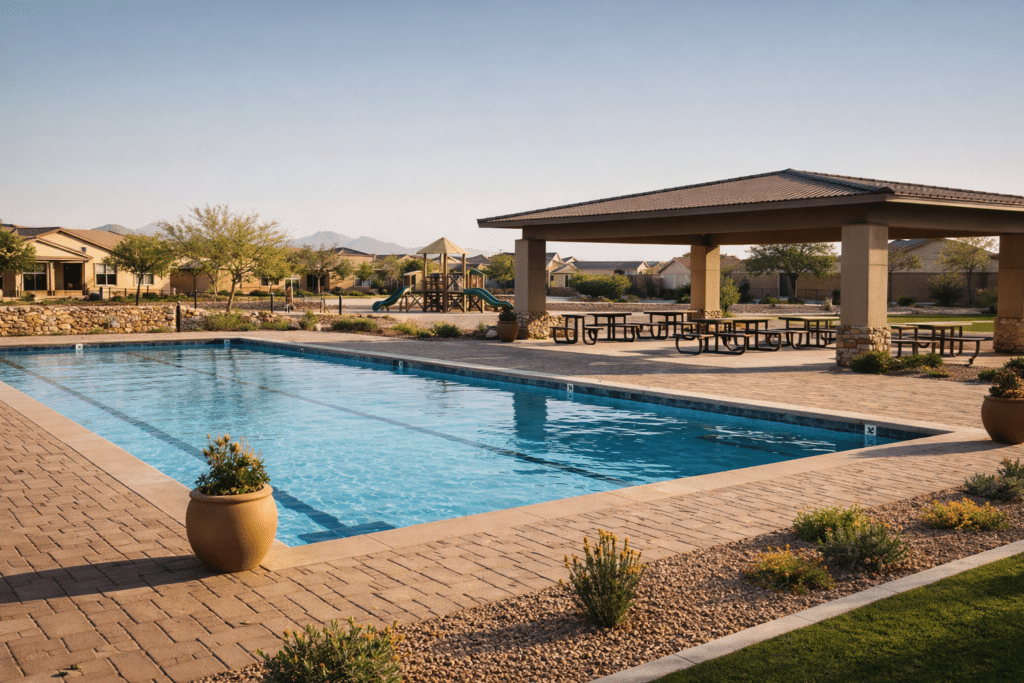
Gilbert is a municipality in the southeastern Phoenix Valley with a development pattern heavily shaped by master-planned communities and HOA governance. In practical terms, that means many neighborhoods include documented amenity infrastructure (parks, community pools, ramadas, trail systems) and standardized exterior maintenance rules (CC&Rs) that influence neighborhood-wide property condition.
A meaningful share of Gilbert’s housing stock was built after 2010, providing access to newer construction relative to many California coastal markets. That can affect near-term maintenance cadence and carrying cost planning, though individual homes vary.
Gilbert sits near Loop 202 (Santan) and US-60 corridor access, supporting connectivity into East Valley employment nodes and the broader Loop 101/202 ring. Distance to Phoenix Sky Harbor is commonly cited around the low-20-mile range depending on routing, with drive times varying by traffic conditions.
Lot sizes at the median price point often land in the 6,000–9,000 sq ft range, with larger lots appearing more frequently as price increases. Relative to many California origin markets, the “space per dollar” outcome tends to be measurably higher across multiple price tiers.
California’s income tax structure is the headline: up to 13.3% at the top marginal rate (plus a 1.1% surcharge over $1M). Arizona applies a flat 2.5% rate. For a $200,000 household, that delta alone can represent roughly $9,000–$12,000 per year in state income tax savings depending on deductions and filing profile.
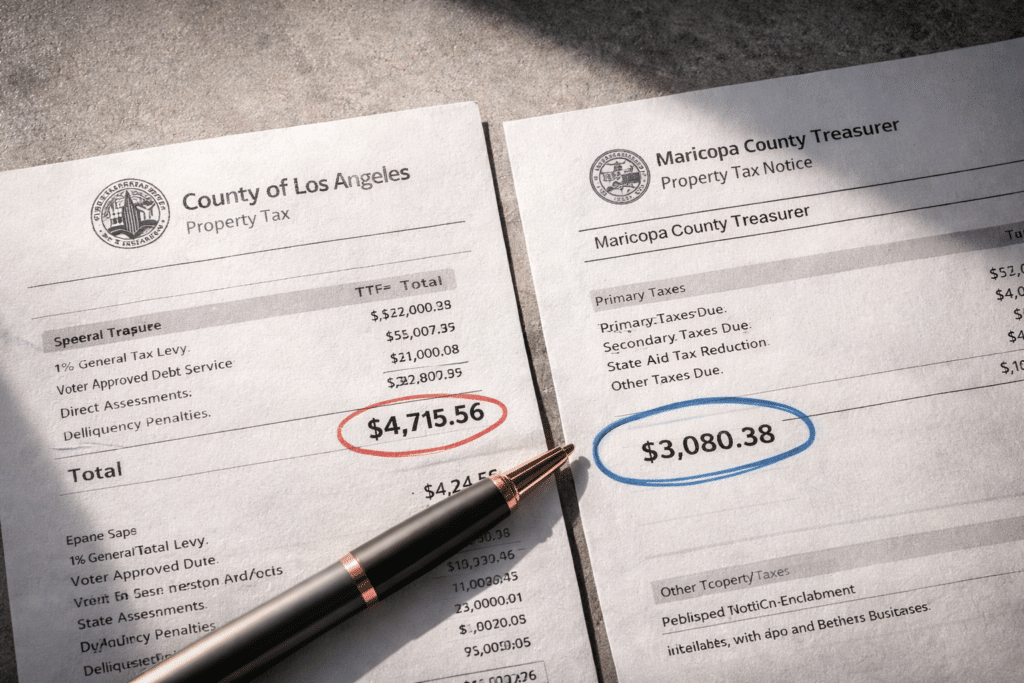
Property tax adds a second lever. Maricopa County’s effective rate is approximately 0.52%. On a $592,250 purchase, an estimated annual property tax bill is about $3,080 (~$257/month), with variation by district and community facilities.
Prop 13 note: Long-term California owners often pay less today due to capped assessments, but that benefit ends at sale. Any new California purchase is assessed at full price. Comparing Gilbert’s effective rate to a full-assessment California purchase is the more relevant planning frame.
| Tax Category | California (LA County) | Gilbert (Maricopa Co.) |
|---|---|---|
| Top State Income Tax Rate | 13.3% (+1.1% surcharge) | 2.5% flat |
| Est. Annual State Income Tax ($200K) | ~$15,000–$18,000 | ~$5,000 |
| Effective Property Tax Rate | ~0.73% | ~0.52% |
| Est. Annual Property Tax ($592K value) | ~$4,323 | ~$3,080 |
| Combined Annual Tax Estimate | ~$19,000–$22,000 | ~$8,000 |
| Estimated Annual Tax Delta | ~$11,000–$14,000 |
Sources: Tax Foundation 2025; Maricopa County Treasurer; California FTB; LA County Assessor. Estimates assume assessment at purchase price and typical effective-rate ranges.
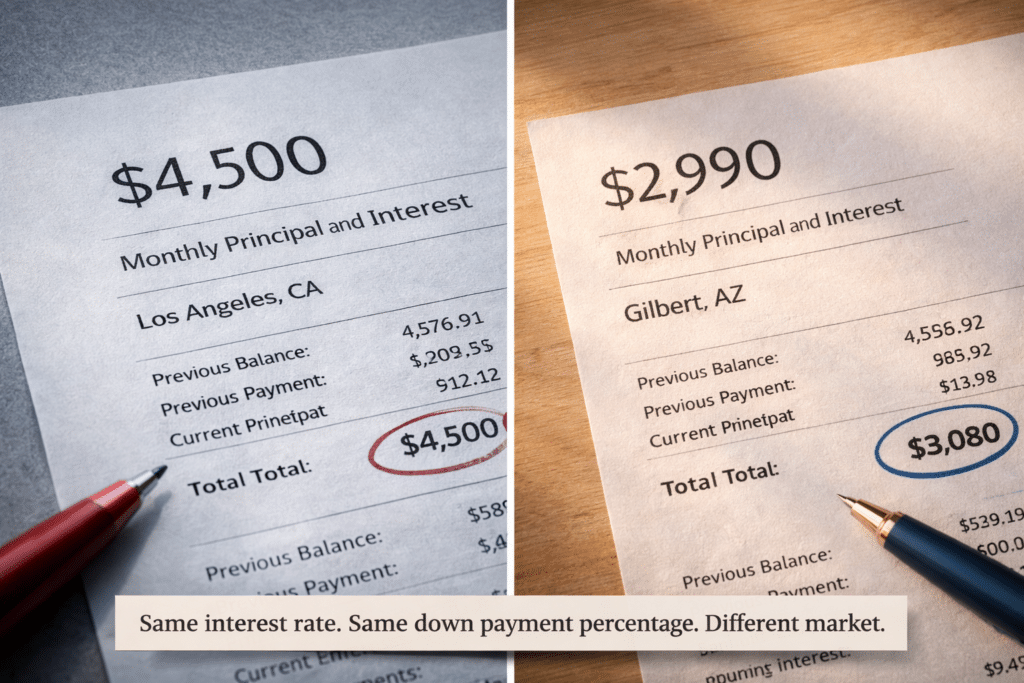
For most households, the mortgage payment is the most visceral comparison. Below is an apples-to-apples estimate using 6.5% and 20% down at median price points.
At median pricing, the principal-and-interest payment drops roughly ~$1,510/month. Bay Area → Gilbert drops roughly ~$3,070/month. San Jose → Gilbert drops roughly ~$4,582/month. These figures exclude additional income tax and property tax savings.
| Origin Market | Median Price | Monthly Payment (6.5%, 20% down) |
|---|---|---|
| Los Angeles County | $890,910 | ~$4,500/mo |
| San Diego County | ~$950,000 | ~$4,797/mo |
| San Francisco / Bay Area | ~$1,200,000 | ~$6,060/mo |
| San Jose / Silicon Valley | ~$1,500,000 | ~$7,572/mo |
| Gilbert, AZ (median) | $592,250 | ~$2,990/mo |
Sources: C.A.R. 2025; ARMLS/FlexMLS 2025. Payment is principal+interest illustrative and excludes property tax, insurance, and HOA. Actual payments vary by rate, credit, down payment, and purchase terms.