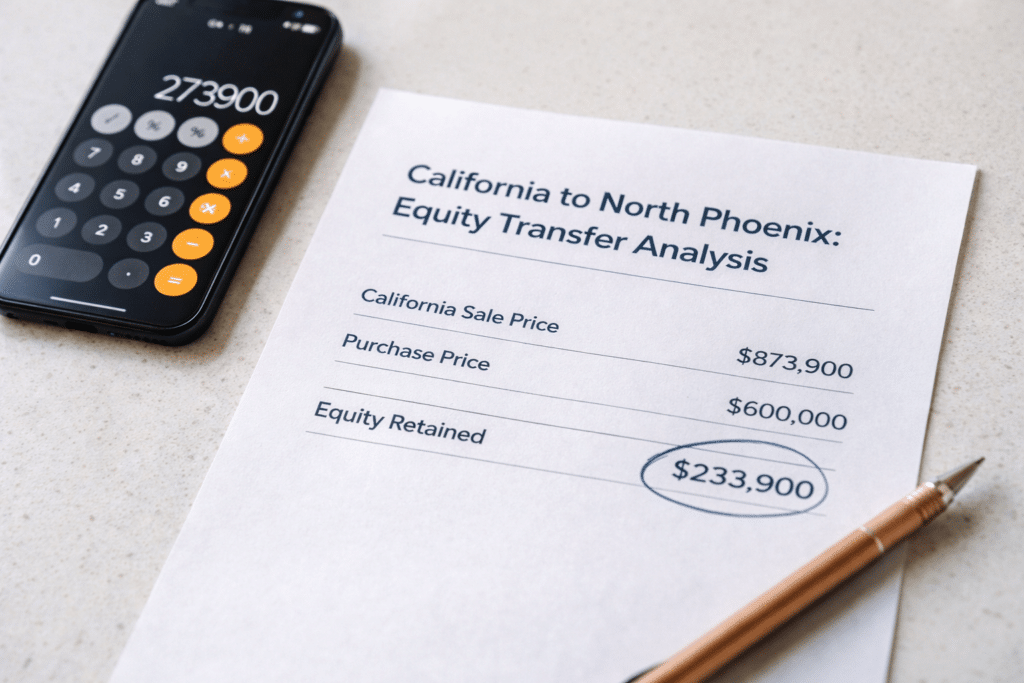
California’s statewide median home price landed at $873,900 in 2025. In North Phoenix, that same equity can acquire a new-construction home in a master-planned community, retain six figures in cash, and reduce your annual state income tax bill by $10,000 or more. This guide runs the math.
The financial logic behind California-to-North Phoenix relocation is not subtle. It is a direct capital transfer from one of the highest-priced housing markets in the nation into a market where comparable or larger inventory trades at a significant discount.
California’s statewide median home price reached $873,900 for the full year 2025, according to the California Association of Realtors. In North Phoenix and the broader Desert Ridge corridor, ARMLS data for 2025 shows single-family inventory ranging from approximately $500,000 to $700,000 depending on sub-market, home size, and whether the purchase is resale or new construction. New construction from the area’s active builder community operating across master-planned communities along the Loop 101 and Loop 51 corridors routinely falls in the $550,000 to $650,000 range for 2,200-to-3,400 square foot floor plans.
The equity gap between a California sale and a North Phoenix purchase is not a rounding error. It is a transaction-level capital event.
Consider a California homeowner selling at the statewide median:
California gross sale price: $873,900 Less: selling costs (~6%): -$52,400 Less: outstanding mortgage (varies): -$350,000 (example) Net proceeds to seller: $471,500
North Phoenix new construction purchase: $600,000 Less: 20% down payment: -$120,000 Remaining equity retained as cash: ~$350,000+
That figure $350,000 or more in retained, liquid capital is the actual financial outcome for a large segment of California homeowners relocating to North Phoenix. For owners with more equity (lower mortgage balances or paid-off homes), the retained capital is substantially higher.
Greater Phoenix’s median sale price was $444,740 in January 2026, per ARMLS, confirming that even mid-range inventory in North Phoenix positions incoming California equity buyers well above the market median in terms of what their capital can acquire.
Illustrative retained equity for a California homeowner selling at the 2025 statewide median and purchasing a $600,000 new-construction home in North Phoenix with a 20% down payment and a $350,000 example mortgage payoff.
The equity gap is the headline number. But the annual tax delta is the figure that compounds over time and ultimately exceeds the one-time equity event for many relocating households.
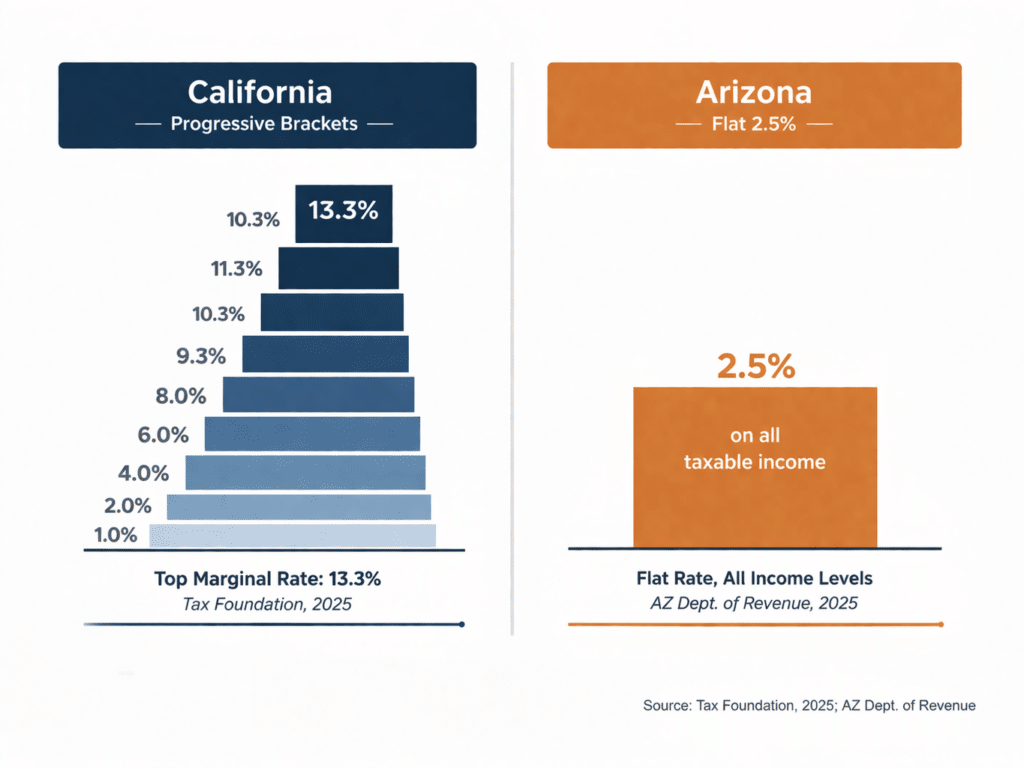
California maintains the highest top marginal state income tax rate in the United States: 13.3%, per the Tax Foundation’s 2025 State Tax Competitiveness data. Arizona replaced its former bracket system with a flat 2.5% rate, effective for tax year 2023 and confirmed for 2025 by the Arizona Department of Revenue. The spread between these two rates is 10.8 percentage points at the top the widest income tax differential of any two adjacent state markets in the western United States.
For a California household earning $150,000 in combined adjusted gross income, the practical difference is material:
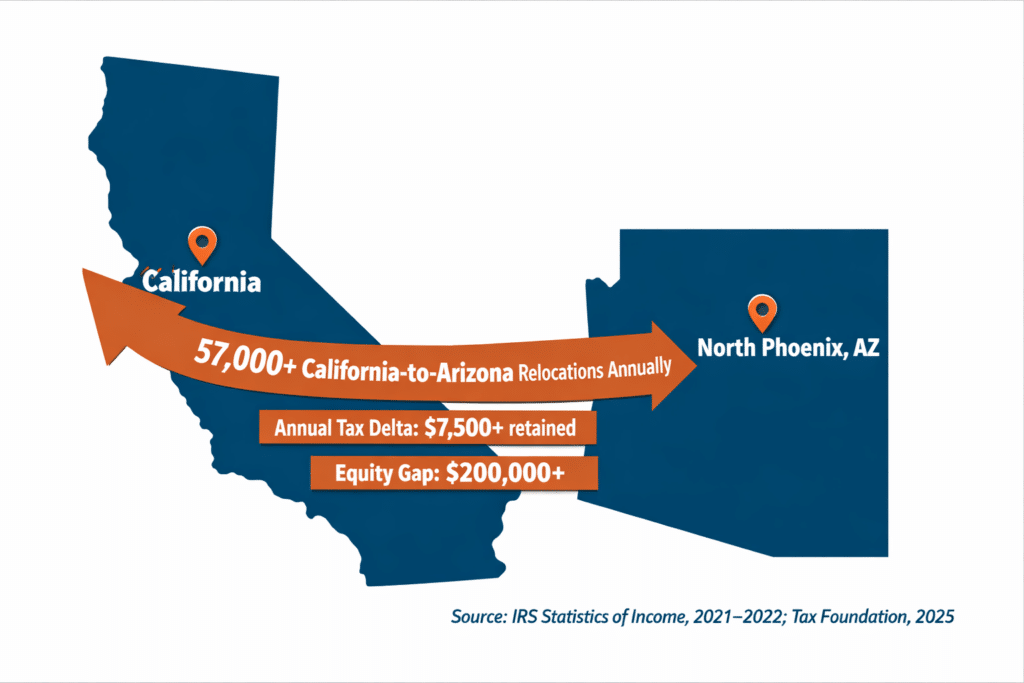
California income tax on $150,000 (effective rate ~7.5%): ~$11,250/year Arizona income tax on $150,000 (flat 2.5%): ~$3,750/year Annual tax delta: ~$7,500/year Five-year cumulative delta: ~$37,500
For households earning $200,000 or more a profile that characterizes a significant portion of California homeowners with the equity to execute this transaction the annual delta widens further and the five-year figure approaches or exceeds $60,000 in retained income.
The tax story does not stop at income. Maricopa County’s median effective property tax rate is 0.52%, according to Maricopa County Treasurer data, versus a national median of 1.02%. For a $600,000 home in North Phoenix, that translates to approximately $3,120 per year in property taxes a fraction of what California property tax bills look like on equivalently valued homes in coastal markets, where assessed values have risen faster than Proposition 13’s 2% annual cap has historically contained them for newer buyers.
Estimated annual state income tax savings for a California household earning $150,000–$200,000 after relocating to Arizona.
Source: Tax Foundation, 2025 State Income Tax Rates; Arizona Department of Revenue (2025); California Franchise Tax Board rate schedule. Note: Estimates are illustrative. Individual liability depends on filing status, deductions, and income composition. Consult a qualified tax professional.
Desert Ridge is the largest master-planned community in North Phoenix and one of the largest in the Phoenix Valley. The development spans approximately 5,700 acres and currently includes over 20,000 existing homes, with an additional 3,000+ homes under construction as of mid-2025, according to City North Desert Ridge development data. Single-family inventory in Desert Ridge ranges broadly across the $550,000 to $750,000 band, with newer construction and larger lot positions trending toward the upper end.
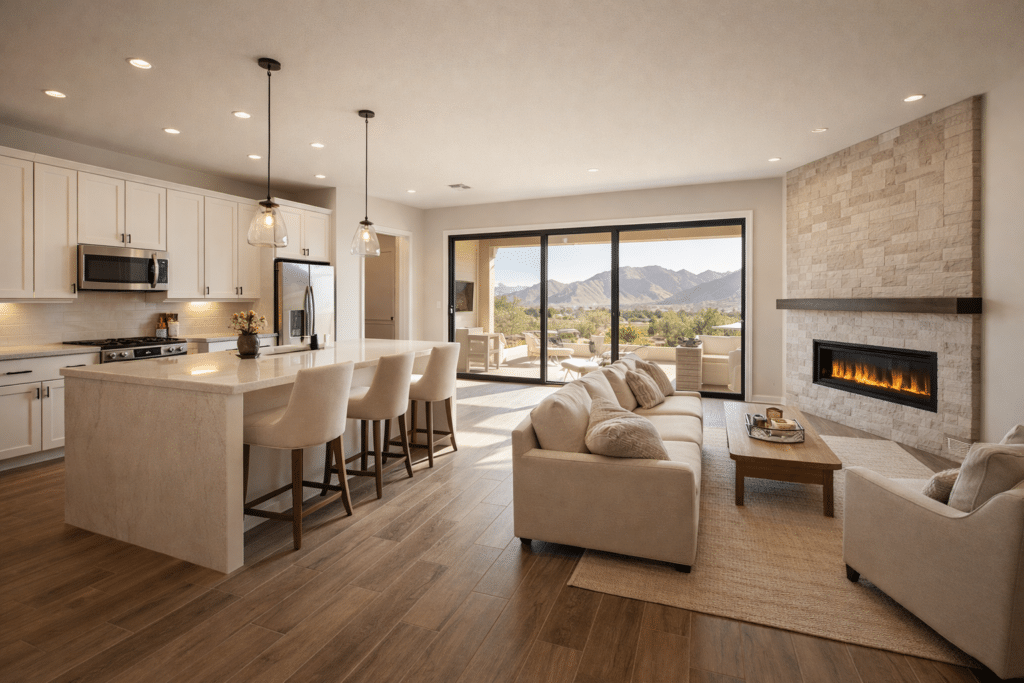
A California homeowner arriving with $600,000 to deploy as a purchase price in the Desert Ridge corridor is acquiring:
– New or newer-construction single-family homes in the 2,200–3,400 square foot range – 3 to 5 bedrooms, 2 to 3.5 bathrooms as standard floor plans – HOA-managed community amenities: pools, parks, walking paths, clubhouses – Covered patio and desert landscaping on standard lot configurations – Proximity to the I-17, Loop 101, and Loop 51 corridors direct access to the greater Phoenix Valley employment grid
For context: $600,000 in California’s coastal markets Los Angeles, San Diego, the Bay Area purchases a median of 900 to 1,400 square feet in established neighborhoods, typically with deferred maintenance and no HOA infrastructure.
The Norterra corridor in the 85085 zip code area represents a second major North Phoenix master-planned cluster, anchored by Union Park at Norterra, a planned development designed as an integrated live-work community. Inventory here trends slightly below Desert Ridge’s price points, offering additional square footage per dollar for equity buyers who prioritize interior space over the Desert Ridge Marketplace retail and entertainment access.
North Phoenix carries one of the highest concentrations of active builder inventory in the Phoenix Valley. The area’s build-out is ongoing, with major national builders operating across multiple sub-communities offering new-construction delivery timelines of 6 to 18 months at the time of this writing. For California equity buyers who have executed their sale and are holding proceeds, new construction in North Phoenix is a viable path that avoids the bidding dynamics of resale inventory.
Source: ARMLS, 2025 YTD market data; City North Desert Ridge development data, 2025.
Understanding North Phoenix requires understanding where it sits within the broader Phoenix Valley pricing spectrum. The Valley is not a single market it is a tiered system, and North Phoenix occupies a specific position in that hierarchy.
North Phoenix sits in the second tier of Valley pricing above the entry-level West Valley markets, and well below Scottsdale’s premium positioning. For California equity buyers who want new construction, HOA infrastructure, and proximity to the Valley’s northern employment corridors including the growing tech and healthcare node around Loop 101 and Scottsdale Road North Phoenix delivers those features at a price point that preserves substantial capital.
The Greater Phoenix median sale price stood at $444,740 in January 2026, per ARMLS STAT (February 2026). North Phoenix inventory trends above that metro median, reflecting the newer housing stock and master-planned community premium. However, for a California buyer arriving with $800,000 to $900,000 in equity, that premium is absorbed entirely within the transaction, with capital remaining.
ARMLS also reported 24,358 active listings across the Greater Phoenix market at the end of January 2026 a 9.63% year-over-year increase confirming that buyers in the current market have real inventory options and reduced time pressure.
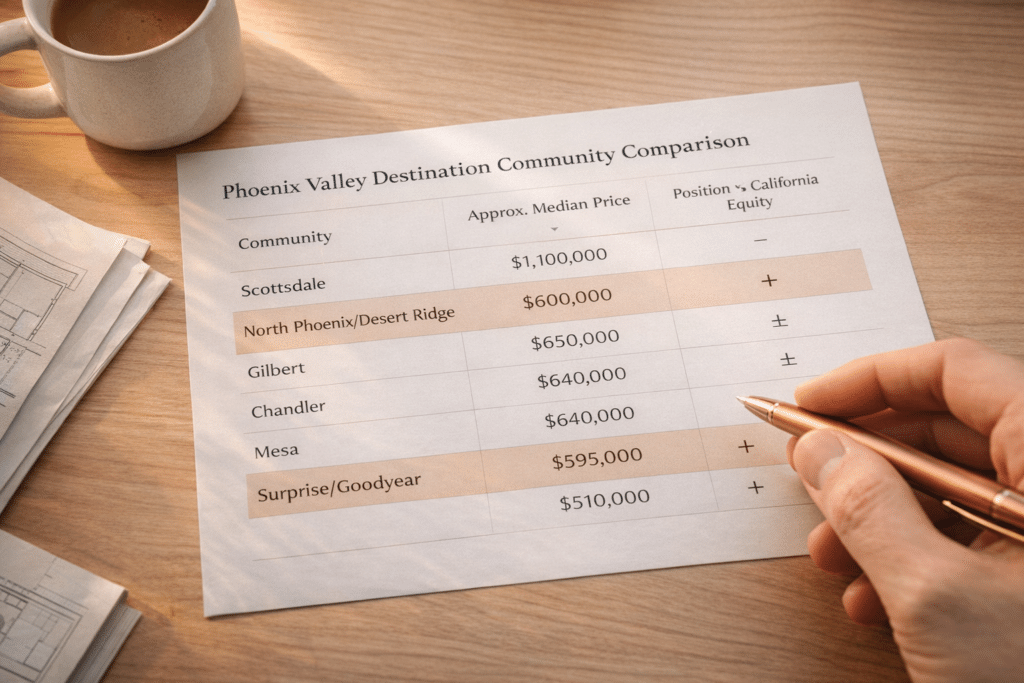
| Community | Approx. Median Price | Position vs. North Phoenix |
|---|---|---|
| Scottsdale | ~$1,180,000 | Premium — highest in Valley |
| North Phoenix / Desert Ridge | ~$550,000–$700,000 | Mid-premium — new build heavy, HOA infrastructure |
| Gilbert | ~$595,000 | Comparable — southeast Valley master-planned |
| Chandler | ~$540,000 | Comparable — tech corridor access |
| Mesa | ~$490,000 | Below median — broader inventory range |
| Surprise / Goodyear | ~$430,000 | Entry point — max sq ft per dollar |
Source: ARMLS, Phoenix REALTORS YTD 2025 reports.
California-to-Arizona migration is not anecdotal. It is one of the most consistently documented domestic migration patterns in IRS and Census Bureau data.
The IRS Statistics of Income state-to-state migration data (2021–2022, the most recent complete dataset) shows California as the single largest net exporter of tax filers to Arizona. Year over year, California sends more individuals and households to Arizona than any other origin state. Within that flow, the profile of the migrant is important: Tax Foundation analysis of IRS data shows that California’s outmigration is disproportionately concentrated in the $100,000–$200,000 household income bracket the homeowner segment, not the entry-level renter segment.
These are households that own property, carry equity, and are making a calculated financial decision. North Phoenix, with its new construction inventory, HOA infrastructure, and proximity to major Valley employment corridors, consistently ranks among the top destination sub-markets within the Phoenix metro for this incoming buyer profile.
U.S. Census Bureau data confirms that over 768,000 current Arizona residents were born in California roughly 1 in 10 Arizonans reflecting decades of accumulated migration from the state’s homeownership class.
Current Arizona residents born in California.
Source: U.S. Census Bureau, American Community Survey, Place of Birth data.