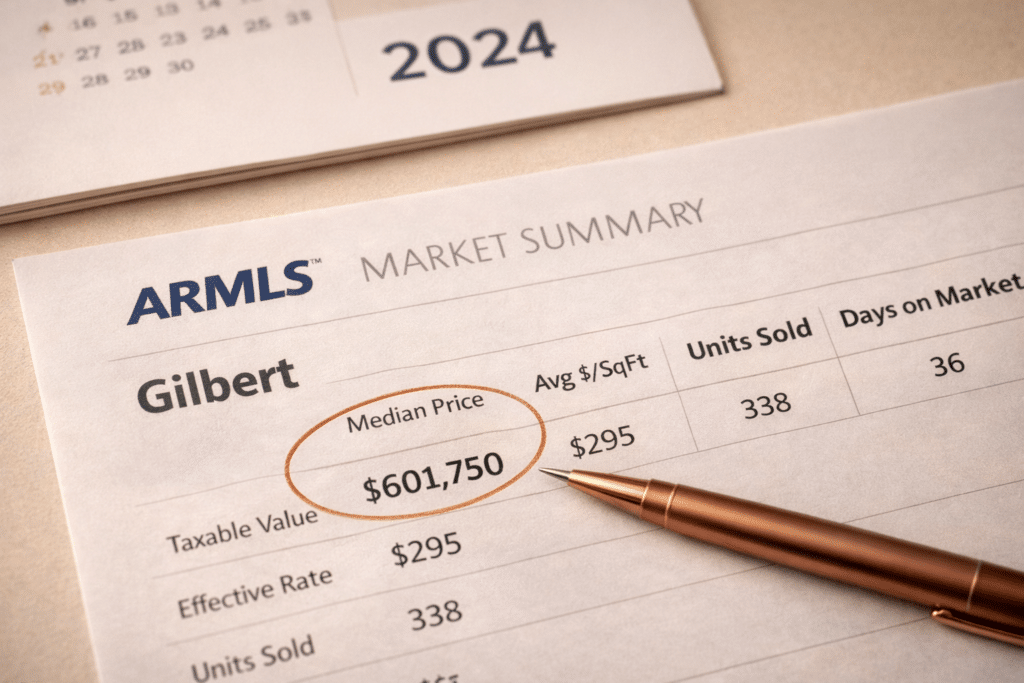
Gilbert’s 2024 full-year median sold price of $601,750 sits $64,000 below Portland’s — and delivers significantly more square footage per dollar at $293 per square foot. For Portland homeowners whose equity positions support a financed purchase in the $500,000 to $900,000 range, Gilbert is the East Valley market where those proceeds go the furthest.
Gilbert’s median price of $601,750 sits meaningfully below Scottsdale’s $1,135,000. That gap has direct consequences for how Portland equity translates to a buying position. In Gilbert, a Portland homeowner with a representative equity position does not need to deploy all available proceeds simply to reach the entry tier. The market’s pricing structure makes Portland equity comparatively powerful — not as a down payment stretched thin to reach a median price, but as a substantial position that can access well above the median with room to spare.
At $601,750, a 20% down payment requires approximately $120,000. A Portland homeowner who has owned since 2015 or earlier, or whose home has appreciated above the metro median, typically holds proceeds that clear that threshold comfortably — and can apply remaining capital toward a higher price point, a larger home, or reduced mortgage principal.
The table below maps representative Portland equity positions to Gilbert purchase price ranges at 20% down.
Gilbert 2024 full-year median sold price (single-family)
SOURCE: ARMLS, 2024 annual data
Gilbert 2024 average sold price per square foot
SOURCE: ARMLS, 2024 annual data
Maricopa County median effective property tax rate
SOURCE: Maricopa County Treasurer; Ownwell, 2024

Source: ARMLS 2024 Annual Data; RMLS Q1 2025
| Portland Net Proceeds (Estimated) | Down Payment (20%) | Gilbert Purchase Price Range | Portland Equity Posture |
|---|---|---|---|
| ~$200,000–$240,000 | 20% | $1,000,000–$1,200,000 | Strong |
| ~$240,000–$280,000 | 20% | $1,200,000–$1,400,000 | Above median |
| ~$280,000–$340,000 | 20% | $1,400,000–$1,700,000 | Well-positioned |
| ~$340,000–$400,000 | 20% | $1,700,000–$2,000,000 | Premium access |
| ~$120,000–$160,000 | 20% | $600,000–$800,000 | Entry tier, Gilbert |
| Cash / large down payment | varies | $500,000–$650,000 | Below-median, high mortgage reduction |
Net proceeds estimated at 94% of sale price after commissions, closing costs, and prorations. Mortgage balance estimates are representative; individual figures depend on original loan terms, purchase year, and prepayment history.
NOTE: Portland homeowners applying 20% down toward a $1M+ Gilbert purchase are accessing the upper tier of Gilbert’s market — above the 2024 median of $601,750. At $293/sq ft (2024 ARMLS average), a $1,000,000 purchase accesses approximately 3,400 sq ft. A $700,000 purchase accesses approximately 2,390 sq ft.
Gilbert’s master-planned communities span a wide price and amenity range. Understanding the HOA structure — what it covers, what it costs, and how it fits into the total carrying cost calculation — is the financially relevant question for Portland buyers evaluating this market. The three community profiles below use only objective, verifiable metrics.
PRICE RANGE: $450,000–$600,000
TYPICAL SQ FT: 1,600–2,400 sq ft LOT SIZE: 5,000–8,000 sq ft
YEAR BUILT RANGE: 2000–2015
HOA FEE RANGE (EST.): $60–$180/month
DOCUMENTED HOA INFRASTRUCTURE: Community pools, pocket parks, walking trails, greenbelt corridors, ramadas. CC&Rs maintain exterior standards including landscaping and exterior finishes.
EMPLOYMENT CORRIDOR PROXIMITY: Approximately 15–25 minutes to Chandler Price Corridor (US-60 / Loop 202 intersection); approximately 20–35 minutes to Phoenix Sky Harbor via Loop 202 / US-60
BUILD-OUT STATUS: Mostly established; limited resale inventory relative to peak-demand levels; minimal new construction at this price tier in central Gilbert
PROPERTY TAX EST. AT $525,000 MIDPOINT: ~$2,730/year (Maricopa County Treasurer, 0.52% effective rate)

PRICE RANGE: $600,000–$850,000
TYPICAL SQ FT: 2,400–3,400 sq ft LOT SIZE: 7,000–12,000 sq ft
YEAR BUILT RANGE: 2005–2020
HOA FEE RANGE (EST.): $100–$250/month
DOCUMENTED HOA INFRASTRUCTURE: Community pools (some with multiple pool nodes), extensive trail systems, greenbelts, parks with playground infrastructure, ramadas, and in some communities access to lakes or detention basins functioning as water amenities. CC&Rs with Architectural Review Committee for exterior change requests.
EMPLOYMENT CORRIDOR PROXIMITY: Loop 202 and US-60 access to Chandler, Tempe, and Mesa employment nodes; approximately 25–45 minutes to Scottsdale Airpark and downtown Phoenix depending on origin point and traffic
BUILD-OUT STATUS: Mix of established and active new development in outer Gilbert sub-markets (south and east quadrant)
PROPERTY TAX EST. AT $725,000 MIDPOINT: ~$3,770/year (Maricopa County Treasurer, 0.52% effective rate)

PRICE RANGE: $850,000–$1,500,000+
TYPICAL SQ FT: 3,000–5,500+ sq ft
LOT SIZE: 10,000–20,000+ sq ft (some custom and semi-custom lots)
YEAR BUILT RANGE: 2010–present; significant new and custom construction
HOA FEE RANGE (EST.): $150–$400+/month depending on amenity scope
DOCUMENTED HOA INFRASTRUCTURE: Master-planned communities with documented amenities including multiple pools, extensive trail and greenbelt networks, full-service parks, and in some communities lake or water feature frontage. Some communities include gated access. Strict CC&R enforcement common.
EMPLOYMENT CORRIDOR PROXIMITY: Loop 202, US-60, and SR-24 (in new outer Gilbert areas) provide regional employment access
BUILD-OUT STATUS: Active new construction pipeline in south and east Gilbert (San Tan Valley-adjacent sub-markets, Cooley Station, and related developments); custom-build opportunities on remaining parcels
PROPERTY TAX EST. AT $1,175,000 MIDPOINT: ~$6,110/year (Maricopa County Treasurer, 0.52% effective rate)
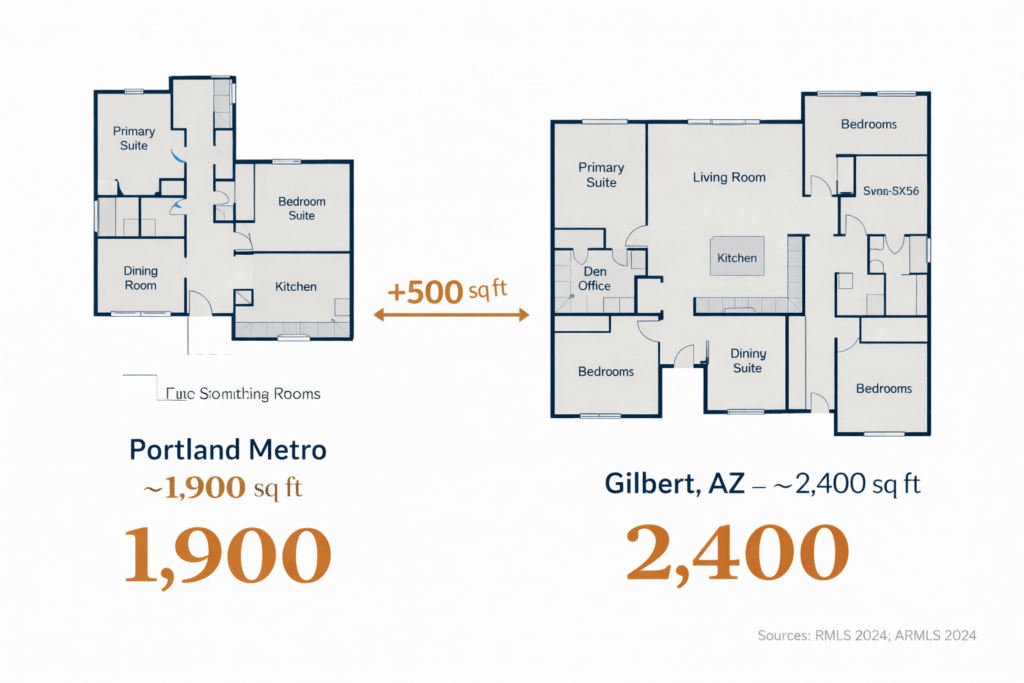
The price-per-square-foot differential between Portland and Gilbert is the most tangible way to express the equity advantage. At Portland’s approximate average of $255–$310 per square foot for homes in the $500,000–$600,000 price range, and Gilbert’s 2024 average of $293 per square foot across its full market, the numerical difference is modest at the midpoint. But that comparison misses the more important variable: lot size, construction age, and HOA infrastructure.
At comparable dollar-per-square-foot costs, Gilbert routinely delivers newer construction, larger lots, and master-planned community amenity infrastructure that is structurally absent in Portland’s comparable price tier.
The table below runs the numbers at representative purchase prices.
| Purchase Price | Portland Typical Sq Ft (at ~$265–$310/sq ft)* | Gilbert Typical Sq Ft (at $293/sq ft avg)** |
|---|---|---|
| $500,000 | ~1,615–1,885 sq ft | ~1,706 sq ft |
| $600,000 | ~1,935–2,265 sq ft | ~2,048 sq ft |
| $700,000 | ~2,260–2,640 sq ft | ~2,389 sq ft |
| $800,000 | ~2,580–3,020 sq ft | ~2,731 sq ft |
| $900,000 | ~2,900–3,530 sq ft | ~3,072 sq ft |
| $1,000,000 | ~3,225–3,920 sq ft | ~3,413 sq ft |
WHAT THE TABLE SHOWS:
At lower price points — $500,000 to $700,000 — the raw square footage numbers are comparable between the two markets. The difference is not in the number on the label. It is in what surrounds the square footage:
In Portland at $600,000: A home built primarily between 1950 and 1990, on a typical lot of 4,000–6,000 square feet in an established urban or near-suburban grid. HOA presence is the exception, not the rule. Community pool or trail infrastructure is typically absent.
In Gilbert at $600,000: A home built primarily between 2000 and 2020, in many cases within an HOA-governed master-planned community with documented amenities — community pools, greenbelt trails, parks, and ramadas — and on a larger lot averaging 6,000–10,000+ square feet depending on the sub-market and development.
At higher price points — $800,000 and above — Gilbert’s newer construction mix and larger lot sizes generate additional differentiation that compounds the physical space advantage.
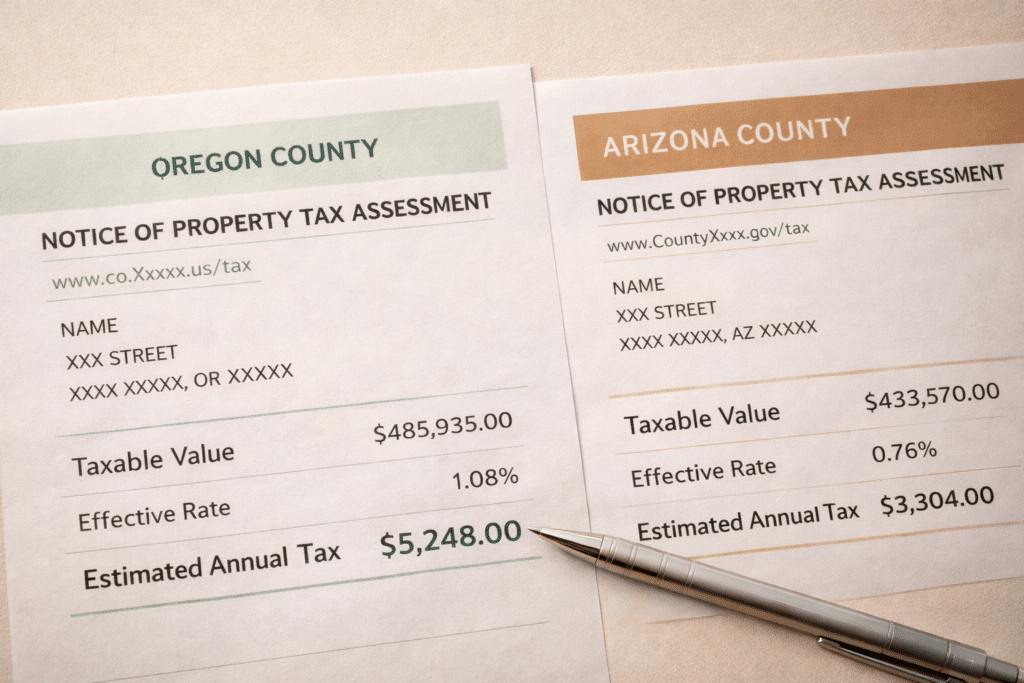
Oregon’s statewide average effective property tax rate is approximately 0.78% of market value (Tax Foundation; Kiplinger Oregon Tax Guide, 2024). Maricopa County’s median effective rate is approximately 0.52% (Maricopa County Treasurer; Ownwell, 2024). The 0.26-percentage-point difference produces annual savings that scale with the purchase price.
For Portland homeowners entering Gilbert’s $500,000–$800,000 price tier, the annual property tax advantage ranges from roughly $1,300 to $2,100 per year. It is not the largest line item in the relocation financial case — the income tax differential carries more weight — but it compounds each year the homeowner holds the property and grows in dollar terms as the assessed value increases.
Estimated annual property tax savings (AZ vs. OR) at Gilbert’s 2024 median price of $601,750 SOURCE: Maricopa County Treasurer; Tax Foundation Oregon Profile, 2024
Over 10 years at the same property value, that differential represents approximately $15,600 in cumulative tax savings — before accounting for annual income tax reduction or equity appreciation at the destination.
| Home Price | OR Effective Rate (~0.78%) | AZ Effective Rate (~0.52%) | Annual Tax Savings in Arizona |
|---|---|---|---|
| $500,000 | ~$3,900/year | ~$2,600/year | ~$1,300/year |
| $600,000 | ~$4,680/year | ~$3,120/year | ~$1,560/year |
| $700,000 | ~$5,460/year | ~$3,640/year | ~$1,820/year |
| $800,000 | ~$6,240/year | ~$4,160/year | ~$2,080/year |
| $900,000 | ~$7,020/year | ~$4,680/year | ~$2,340/year |
| $1,000,000 | ~$7,800/year | ~$5,200/year | ~$2,600/year |
Source: Maricopa County Treasurer (AZ effective rate ~0.52%); Tax Foundation / Kiplinger Oregon Tax Guide (OR effective rate ~0.78%, 2024). Rates expressed as percentage of market value. Individual assessed values may differ from market value; consult Maricopa County Assessor and Oregon county assessor for property-specific tax data.
Gilbert’s 2024 full-year ARMLS data reflects a market that grew modestly in price while showing a slight compression in sales volume — 2,756 single-family homes sold in 2024, down approximately 3.2% from 2,847 in 2023. The median sold price rose 5.6% to $601,750. The average price per square foot moved from $277 in 2023 to $293 in 2024 — an increase of 5.8%.
This is not a market that ran away from buyers in 2024. It appreciated steadily but not exponentially, and the modest reduction in unit sales volume, combined with growth in active listings across the East Valley, gave 2024 and early 2025 buyers more negotiating leverage than peak-market conditions allowed.
Heading into 2025, the broader Phoenix Valley trend of rising inventory and extending days on market applies to Gilbert as well. For Portland homeowners who have been hesitant to enter an overheated market, the current structure is more accommodating.
| Metric | Value / Source |
|---|---|
| 2024 Median Sold Price (single-family) | $601,750 (ARMLS, 2024 annual) |
| 2024 Average Sold Price (single-family) | $709,950 (ARMLS, 2024 annual) |
| 2024 Avg. Sold Price per Sq Ft | $293/sq ft (ARMLS, 2024) |
| 2024 Total Units Sold (single-family) | 2,756 homes (ARMLS, 2024) |
| YoY Median Price Change (2023→2024) | +5.6% (ARMLS, 2024) |
| YoY Avg. Price per Sq Ft Change | +5.8% ($277→$293, ARMLS) |
| Dec 2025 Median Sale Price | ~$579,000 (Redfin, Dec 2025) |
| Maricopa County Eff. Property Tax Rate | ~0.52% (Maricopa County Treasurer) |
| Build-Out Status | Established central + active new development (south/east Gilbert) |
| HOA Presence | Prevalent in master-planned communities; fee range $60–$400+ |
Source: ARMLS transaction data via SWEE Phoenix Homes market analysis (2024 annual); Redfin Gilbert market data (December 2025); Maricopa County Treasurer; Ownwell Maricopa County analysis, 2024.
One data point worth flagging for Portland buyers: the December 2025 Redfin figure of approximately $579,000 median sits $22,750 below the 2024 full-year ARMLS median. This reflects seasonal variation and the market recalibration visible across the Phoenix metro in late 2025, as inventory growth extended days on market and gave buyers more room to negotiate. Portland homeowners entering this market in 2025 and 2026 may find more favorable entry conditions than those who evaluated the market during peak-demand periods.
Most of Gilbert’s master-planned communities operate under HOA governance. From a financial planning standpoint, the HOA fee is a mandatory carrying cost that must be added to principal, interest, property taxes, and insurance (PITI) when modeling the total monthly housing cost at any Gilbert property.
HOA fees in Gilbert’s single-family home communities generally range from approximately $60 to $180 per month for lower-amenity developments, and from approximately $100 to $400+ per month for full-amenity master-planned communities with multiple pools, extensive trail systems, and lake or greenbelt infrastructure. Some premium communities carry additional costs beyond the base HOA fee — such as Architectural Review Committee filing fees or separate access fees for certain amenities.
What HOA fees do not cover: individual lot landscaping (unless specified), utilities, interior maintenance, or property taxes.
For Portland homeowners who are accustomed to neighborhoods without HOA governance, the monthly HOA fee represents a new budget line item. The practical offset: HOA-governed communities in Gilbert typically provide documented amenity access — community pools, maintained trails — that Portland homeowners would otherwise pay for separately through gym memberships, recreation center dues, or private club fees.
Community swimming pool and pool maintenance costs
Common area and greenbelt landscaping maintenance
Park and trail system upkeep Ramada and gathering space maintenance
Reserve fund contributions for future infrastructure replacement
CC&R enforcement and Architectural Review Committee administration
| Metric | Value / Source |
|---|---|
| 2024 Median Sold Price (single-family) | $601,750 (ARMLS, 2024 annual) |
| 2024 Average Sold Price (single-family) | $709,950 (ARMLS, 2024 annual) |
| 2024 Avg. Sold Price per Sq Ft | $293/sq ft (ARMLS, 2024) |
| 2024 Total Units Sold (single-family) | 2,756 homes (ARMLS, 2024) |
| YoY Median Price Change (2023→2024) | +5.6% (ARMLS, 2024) |
| YoY Avg. Price per Sq Ft Change | +5.8% ($277→$293, ARMLS) |
| Dec 2025 Median Sale Price | ~$579,000 (Redfin, Dec 2025) |
| Maricopa County Eff. Property Tax Rate | ~0.52% (Maricopa County Treasurer) |
| Build-Out Status | Established central + active new development (south/east Gilbert) |
| HOA Presence | Prevalent in master-planned communities; fee range $60–$400+ |
Note: On a pure PITI basis at equal purchase prices, Gilbert and Portland carry approximately the same monthly cost — the Oregon property tax premium is largely offset by the Arizona HOA fee at mid-range levels. The financial advantage of Arizona materializes most significantly in the income tax line, not the housing payment itself at equivalent purchase prices. This is an honest framing of the math.
IMPORTANT NOTE: These are illustrative estimates only. Mortgage payments depend on rate, credit profile, and loan structure. Property tax bills depend on the specific assessed value and applicable exemptions. HOA fees depend on the specific community. Insurance costs depend on the carrier, coverage level, and property characteristics. Consult a licensed lender and your real estate agent for property-specific carrying cost projections.
Gilbert’s central and established sub-markets — Morrison Ranch, Power Ranch, Val Vista Lakes — are substantially built out. Resale inventory dominates the $500,000–$800,000 price tier in these areas. New construction in Gilbert is concentrated in the town’s south and east quadrants, where active development pipelines are adding single-family homes in communities such as Cooley Station and adjacent planned developments along the SR-24 corridor.
For Portland buyers who prefer new construction — with its modern mechanical systems, energy-efficient envelopes, builder warranties, and contemporary floor plans — Gilbert’s outer sub-markets provide that option at price points that often start below the city’s resale median.
The construction quality distinction between new and resale carries a financial implication that Portland buyers should model explicitly:
New construction (2020s): Modern HVAC specifications, radiant attic barriers, Low-E window glazing, and current insulation standards. Lower near-term maintenance cost profiles. Builder warranties on structure (typically 10 years), mechanical systems (typically 2 years), and workmanship (typically 1 year). Higher initial price relative to square footage in some sub-markets.
Resale (2000–2015 vintage): Established neighborhoods, mature landscaping, larger established lots in some cases. Lower per-square-foot entry cost in some sub-markets. Near-term capital expenditure risk depends on age and maintenance history of mechanical systems.
The property tax savings at Gilbert price points are meaningful but not transformative in isolation. The income tax differential is where the larger financial case is built.
Portland-area residents subject to Oregon state income tax (4.75%–9.9%), Multnomah County income tax (1.5%–3%), and the Metro Supportive Housing Services income tax (1%) face a combined earned-income tax burden that can reach 13.9% at upper-middle income levels — the highest combined local income tax burden in the nation, per the Tax Foundation’s 2026 State Tax Competitiveness Index.
Arizona’s flat income tax rate: 2.5%. No county surcharges. No metro-level income taxes.
At a $150,000 household income, the combined income tax difference is approximately $9,000–$10,000 per year in Arizona’s favor, after accounting for Oregon’s lack of a state sales tax
Adding the income tax savings to the property tax savings at Gilbert’s price tier produces a combined annual financial advantage in the range of $10,500–$12,000 per year for a household at $150,000 income purchasing a home at approximately $650,000. That figure is the annualized financial case for the move — before any home price appreciation or equity consideration.
Our brokerage partner, West USA Realty, represents buyers relocating to Gilbert, Chandler, Scottsdale, and all Phoenix Valley communities. Connect directly with a licensed Arizona agent at westusa.net.

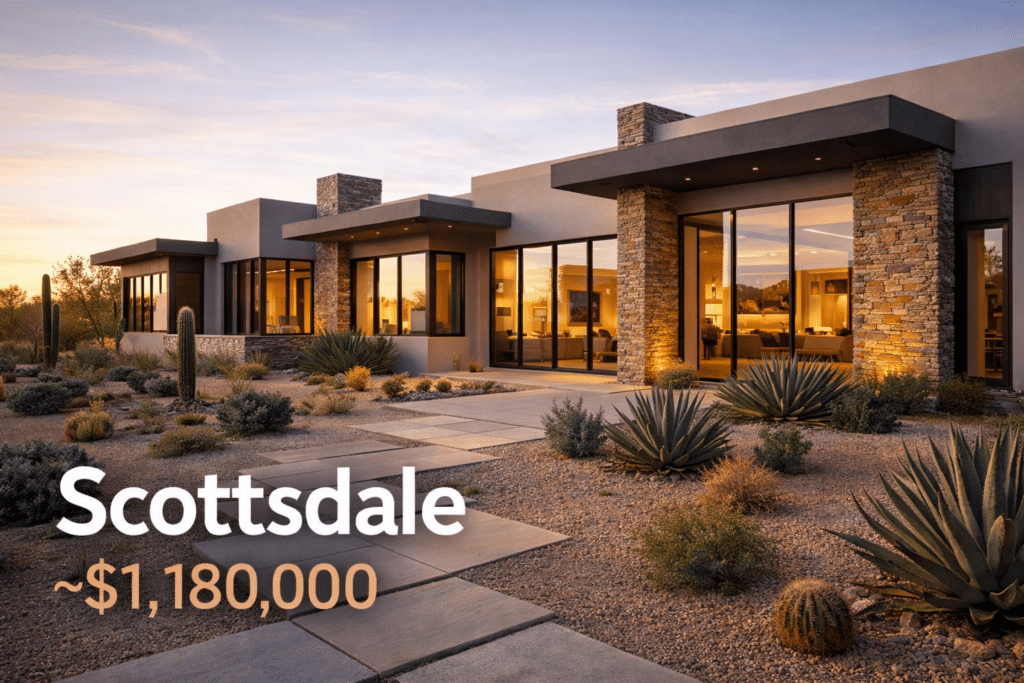
Scottsdale 2024 MEDIAN PRICE: $1,135,000
AVG. PRICE/SQ FT: $481/sq ft
EQUITY NEEDED (20% DOWN): ~$227,000 at median
Chandler 2024 MEDIAN PRICE: ~$505,000–$565,000 (est.)
AVG. PRICE/SQ FT: ~$270–$295/sq ft (est.)
EQUITY NEEDED (20% DOWN): ~$103,000–$117,000 at median
A: The full-year 2024 median sold price for single-family homes in Gilbert was $601,750, up 5.6% from 2023, according to ARMLS transaction data. The average sold price per square foot in 2024 was $293, up from $277 in 2023. As of December 2025, the median sale price was approximately $579,000, reflecting seasonal variation and broader Phoenix Valley market recalibration.
A: A Portland homeowner selling at the metro median of approximately $537,000 with a representative mortgage balance may generate net proceeds in the range of $200,000 to $380,000. Applied as a 20% down payment in Gilbert, that equity supports purchase prices of $1,000,000 to $1,900,000. At Gilbert’s 2024 average of $293 per square foot, those prices translate to approximately 3,400 to 6,500 square feet — materially more than the 1,600 to 2,100 square feet a comparably priced Portland home typically delivers.
A: For Portland homeowners evaluating the financial case, Gilbert offers a lower median price than Scottsdale, lower property taxes via Maricopa County’s 0.52% effective rate versus Oregon’s 0.78% average, and substantially more square footage per dollar at $293/sq ft. The town’s active new construction pipeline and established HOA-governed master-planned community infrastructure provide options for buyers who prefer newer-build housing stock.
A: Gilbert is within Maricopa County, where the median effective property tax rate is approximately 0.52% of market value (Maricopa County Treasurer; Ownwell, 2024). On a $600,000 home, the estimated annual property tax is approximately $3,120. Oregon’s statewide average effective rate is approximately 0.78%, producing an estimated bill of approximately $4,680 on the same value — a difference of roughly $1,560 per year.
