Mesa’s 2025 full-year median sold price is $490,000 — the lowest among the primary East Valley destination communities and the figure that produces the highest cash retention at closing for California sellers. An LA County seller at the December 2025 county median of $890,910 retains approximately $325,000–$340,000 purchasing at the Mesa median. A San Jose seller retains approximately $895,000. Mesa is the maximum equity retention story in the Valley.
Among the primary Phoenix Valley destination communities for California buyers — Gilbert, Chandler, Scottsdale, Mesa — Mesa’s $490,000 full-year 2025 median produces the largest gap between California net proceeds and Arizona purchase price. That gap is retained equity: capital that was locked inside a California home and exits the transaction in liquid form.
The 2025 full-year figures from FlexMLS confirm that Mesa’s median sold price decreased approximately 1.0% year-over-year, from $495,000 in 2024 to $490,000 in 2025. That modest softening is a buyer’s data point: a slight downward drift in median pricing on a $490,000 base means California sellers are purchasing into a market where asking prices have moderated, inventory has expanded, and negotiating leverage has shifted measurably toward buyers compared to the 2021–2022 peak.
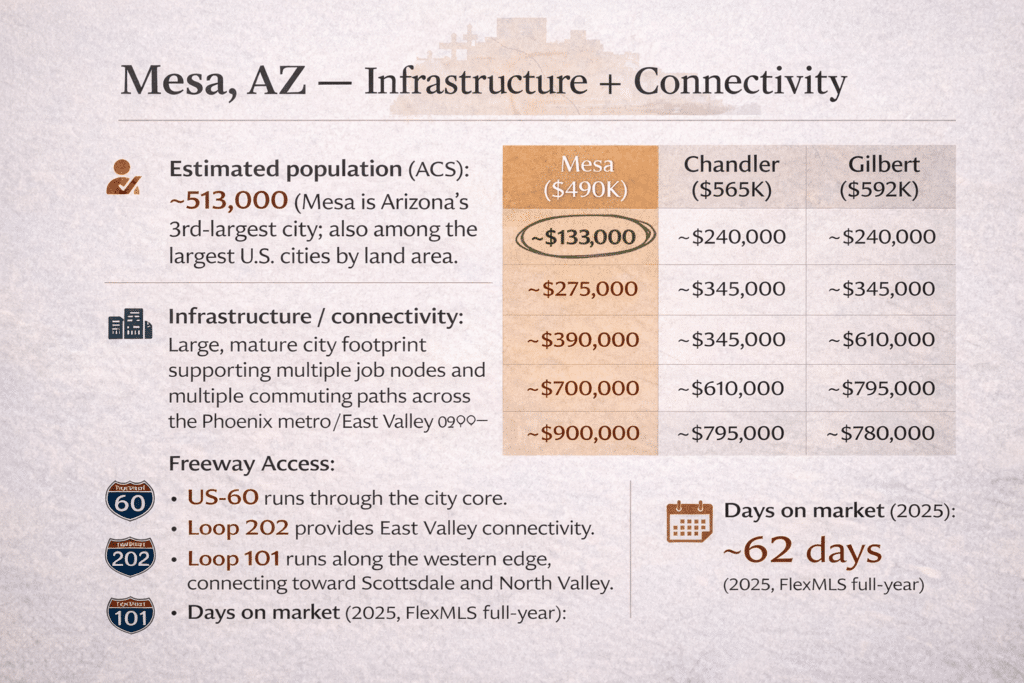
The inventory depth compounds this advantage. Mesa is Arizona’s third-largest city by population, with approximately 513,000 residents per U.S. Census Bureau American Community Survey estimates. That scale produces a housing market with significantly broader inventory than any other East Valley community — from entry-level resale below $350,000 in West Mesa to luxury product above $1M in Northeast Mesa’s lakefront and golf-corridor communities. California buyers working with a wide range of net proceeds find the widest menu in the Valley here.
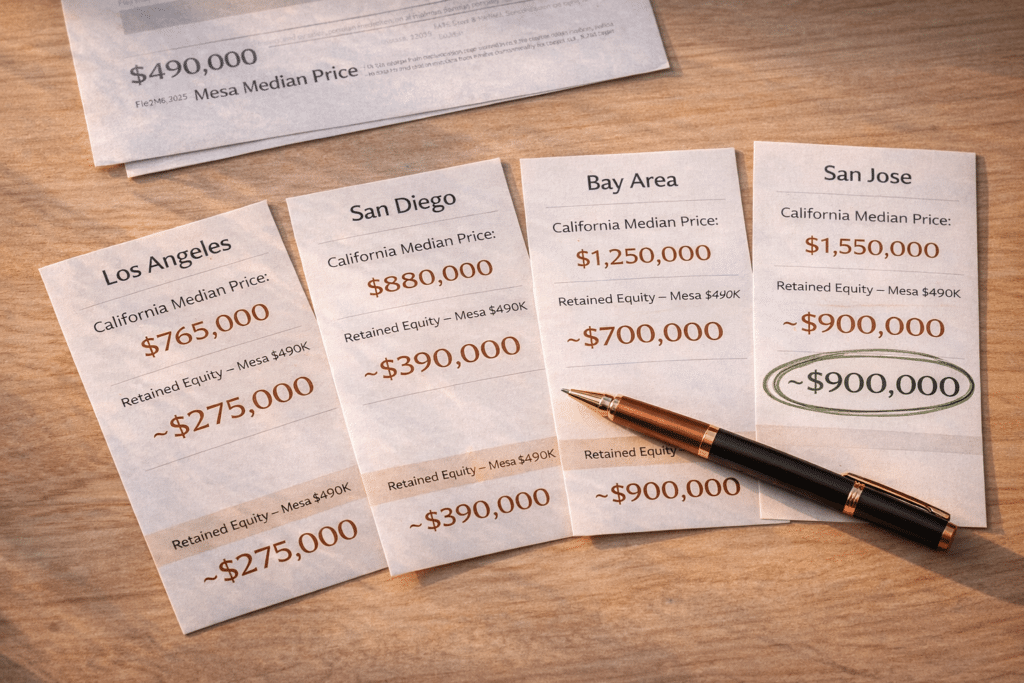
The table below maps four California origin markets against a Mesa purchase at the 2025 full-year median of $490,000. Assumptions: ~6% transaction costs on the California sale; Arizona closing costs ~$7,000–$11,000 at this price point.
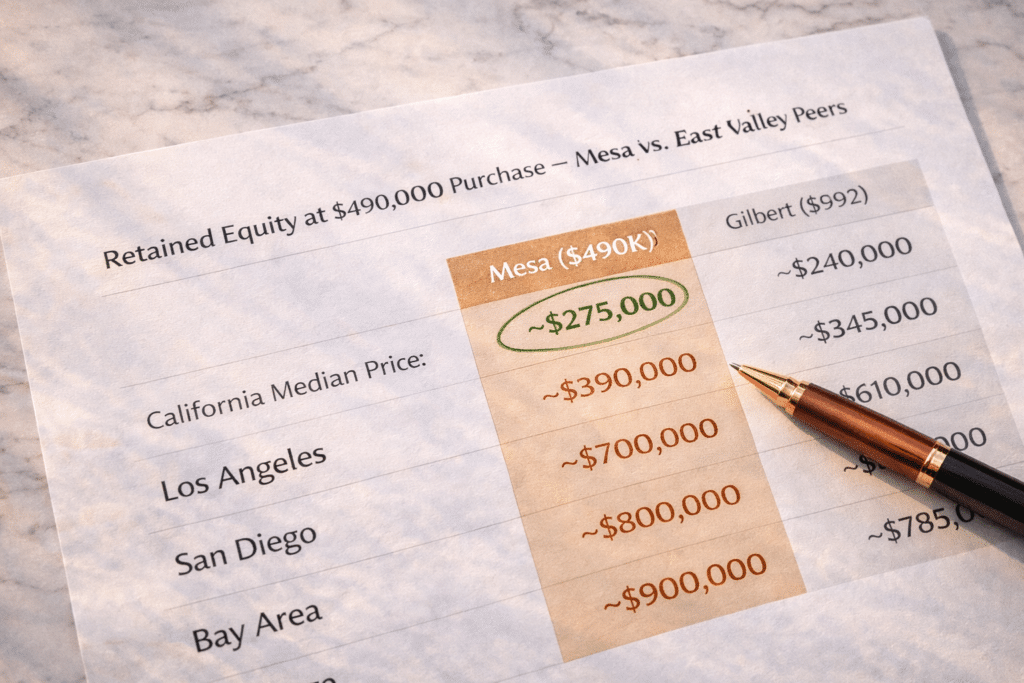
Compared to East Valley peers, Mesa’s lower median increases retained equity at closing. For an LA County seller, retained equity at Mesa is typically ~$55,000–$80,000 higher than Chandler or Gilbert at their respective medians. At the San Jose level, retained equity at Mesa can be large enough to purchase the home outright and still retain six figures beyond the property cost.
| California Origin Market | CA Median (2025) | Est. Net CA Proceeds | Mesa Purchase | Est. Equity Retained |
|---|---|---|---|---|
| Los Angeles County | $890,910 | ~$837,000–$838,000 | $490,000 | ~$325,000–$340,000 |
| San Diego County | ~$950,000 | ~$893,000 | $490,000 | ~$378,000–$395,000 |
| SF / Bay Area | ~$1,200,000 | ~$1,128,000 | $490,000 | ~$615,000–$630,000 |
| San Jose / Silicon Valley | ~$1,500,000 | ~$1,410,000 | $490,000 | ~$895,000–$910,000 |
Sources: California Association of Realtors (December 2025); FlexMLS (Mesa, 2025 full-year); Maricopa County standard closing cost estimates. Figures are estimates; transaction costs vary.
At ~$258–$270 per square foot (FlexMLS, 2025), Mesa’s $490,000 median translates to roughly 1,815–1,900 square feet at the citywide midpoint. The gap between the $490,000 median and the $558,523 average sold price reflects Mesa’s inventory breadth: more expensive product in Northeast Mesa and Red Mountain lifts the average, while older resale and smaller-footprint inventory in West/Central Mesa anchors the median.
Mesa’s footprint (about 140 square miles) creates distinct submarkets with different housing stock ages, lot sizes, and price bands.

West/Central Mesa resale inventory. Often 1,100–1,600 sq ft, lots ~4,500–7,000 sq ft, two-car garages. Highest inventory depth and strongest retention outcome for California sellers prioritizing maximum liquid capital at closing.
Core detached market. Often 1,600–2,200 sq ft, lots ~6,000–8,500 sq ft, two- and three-car garages. HOA-governed communities more common in Southeast Mesa and portions of Northeast Mesa.
Northeast Mesa / Eastmark / Red Mountain corridor. Often 2,200–3,200 sq ft with newer construction patterns and expanded amenity packages in HOA communities. Larger lots become more common.
Premium inventory including larger-lot custom and semi-custom product in far Northeast Mesa and Red Mountain corridor bands. This tier contributes to the higher citywide average sold price.
Price data: FlexMLS, Mesa single-family homes, 2025 full-year.
Mesa is Arizona’s third-largest city (approx. 513,000 residents), and its footprint stretches from the Salt River area in the west to the northeast boundary near the Tonto National Forest. This creates meaningful corridor differences in housing stock age and pricing.
Freeway access centers on US-60 through the city core and Loop 202 providing connectivity across the East Valley. Loop 101 runs along the western edge, connecting toward Scottsdale and the North Valley. Sky Harbor distance varies by submarket but is commonly modeled around ~10–18 miles via US-60 and connecting corridors.
Employment proximity includes major regional employers and access to the broader East Valley employment ring; Mesa’s larger footprint also supports multiple job nodes and commuting paths across the metro.
Days on market (2025): ~62 days (FlexMLS, 2025 full-year)
HOA prevalence: mixed (lower in older West/Central Mesa; higher in Southeast/Northeast master-planned corridors)
Mesa estimated population (ACS) — Arizona’s third-largest city and among the largest U.S. cities by land area.
Mesa is in Maricopa County, so the same effective property tax rate (~0.52%) applies as in Gilbert/Chandler/Scottsdale. The difference is the base: at $490,000, Mesa’s estimated annual property tax is about $2,548, the lowest absolute property tax bill among the major East Valley medians.
| Tax Category | California | Arizona / Maricopa County |
|---|---|---|
| Top State Income Tax Rate | 13.3% (+ 1.1% surcharge) | 2.5% flat |
| Effective Property Tax Rate | ~0.73% | ~0.52% |
| Avg Combined Sales Tax | 8.82% | 8.40% |
| Property Tax on $490,000 Home | ~$3,577/yr (CA equiv.) | ~$2,548/yr |
| State Income Tax on $200K AGI | ~$15,000–$18,000/yr | ~$5,000/yr |
| State Income Tax on $300K AGI | ~$27,000–$32,000/yr | ~$7,500/yr |
Sources: Tax Foundation (2025); Maricopa County Treasurer; California Franchise Tax Board.
For a $200,000 household, total annual tax savings (income tax plus property tax delta) commonly models at ~$11,000–$14,000/year. Over 10 years, that’s ~$110,000–$140,000 in cumulative tax savings — separate from and additive to the retained equity at closing.
At 6.5%, 30-year fixed, 20% down, estimated P&I on a $490,000 Mesa purchase is ~$2,478/month — the lowest among the primary East Valley destinations. Add property tax (~$212/month) and HOA dues (often $0–$120/month depending on neighborhood), and a median-tier Mesa housing cost often models around ~$2,690–$2,810/month.
A Bay Area household can combine the mortgage delta with Arizona’s income tax savings to produce a first-year improvement that can exceed ~$50,000 depending on income. For San Jose sellers, Mesa can represent the largest single monthly payment reduction in the Valley at a community median.
Estimated monthly mortgage payment reduction for a Bay Area seller purchasing at the Mesa median versus carrying a Bay Area mortgage at its median value.

| Origin Market | CA Median | CA Monthly P&I (6.5%, 20% dn) | Mesa Monthly P&I | Monthly Delta |
|---|---|---|---|---|
| Los Angeles County | $890,910 | ~$4,501 | ~$2,478 | ~$2,023/mo |
| San Diego County | ~$950,000 | ~$4,800 | ~$2,478 | ~$2,322/mo |
| SF / Bay Area | ~$1,200,000 | ~$6,062 | ~$2,478 | ~$3,584/mo |
| San Jose / Silicon Valley | ~$1,500,000 | ~$7,577 | ~$2,478 | ~$5,099/mo |
Sources: C.A.R. Dec 2025; FlexMLS Mesa 2025; mortgage math uses 6.5% 30-year fixed, 20% down, P&I only.
Santa Clara County is not one market. The equity event scales by submarket. Snapshot ranges below are based on available county data and commonly reported local MLS ranges through 2025.

$330,000–$460,000
Older resale (1950s–1980s), smaller footprints, many non-HOA areas, high inventory depth.
$380,000–$520,000
1970s–1990s resale mix, HOA and non-HOA patterns, broad housing-type range.
$450,000–$640,000
More HOA-governed master-planned product, 1990s–2010s dominant, similar product profile to Chandler’s mid-tier at a lower base price.
$500,000–$850,000
New construction corridor with larger footprints and expanded HOA amenity packages, Loop 202 access.
$480,000–$900,000
Varied product mix, larger lots at higher tiers, corridor anchored by US-60 access.
$400,000–$600,000
Mixed resale and newer product with access patterns toward Loop 101 at the western reach of the corridor.
Submarket ranges approximate trailing sales distributions; individual transactions vary.
Mesa’s lower median increases retained equity, while housing stock age varies more widely than Chandler/Gilbert. Buyers prioritizing newer construction can target Southeast Mesa or Northeast Mesa/Eastmark while still preserving stronger retention than Chandler or Gilbert medians.
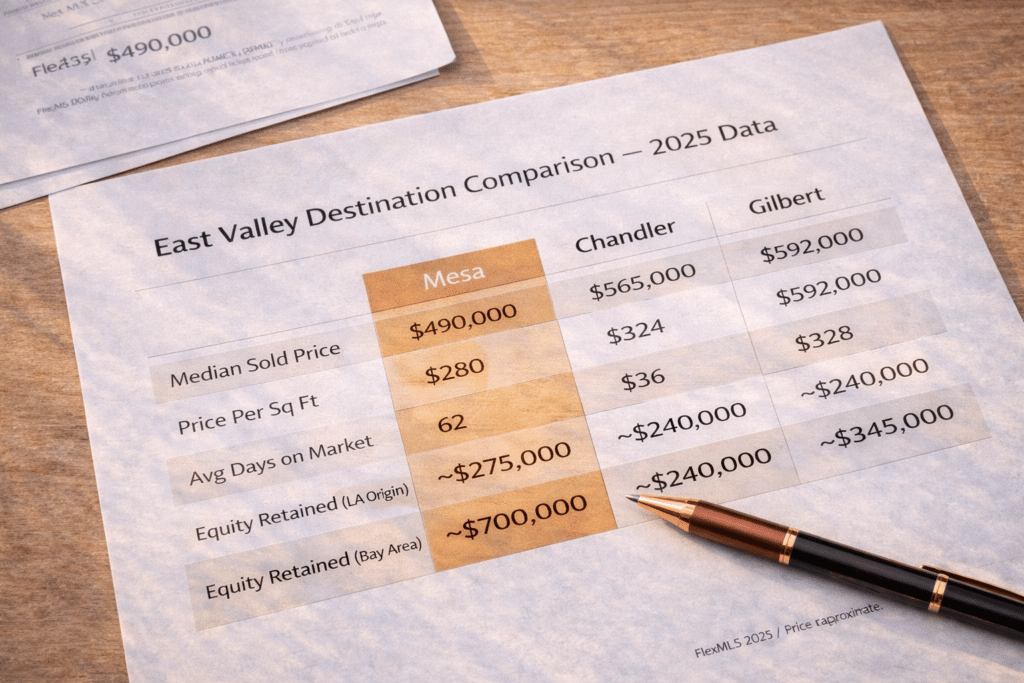
| Metric | Mesa | Chandler | Gilbert |
|---|---|---|---|
| 2025 Median Sold Price | $490,000 | $565,000 | $592,250 |
| Avg Price Per Sq Ft | ~$258–$270 | ~$287–$297 | ~$269–$280 |
| Avg Days on Market | ~62 days | ~55–62 days | ~62–64 days |
| Equity Retained (LA origin) | ~$325K–$340K | ~$270K–$285K | ~$240K–$260K |
| Equity Retained (Bay Area) | ~$615K–$630K | ~$540K–$560K | ~$520K–$545K |