Santa Clara County’s median single-family home price was $1,935,250 in November 2025 (California Association of Realtors). Greater Phoenix was $450,000. The $1,485,000 spread between those figures is the largest equity gap in the California silo and for Silicon Valley homeowners it is compounded by a tax structure that captures 13.3% of wage income and applies fully to equity compensation. Arizona’s 2.5% flat rate changes the math on both fronts at the same time.
Santa Clara County’s November 2025 median of $1,935,250 is not an outlier. It is the midpoint meaning half of all single-family sales closed above that number. In submarkets such as Cupertino, Palo Alto, Sunnyvale, and Los Altos, transactions above $2M, $2.5M, and $3M are routine. Even San Jose proper, typically tracking the lower end of the county spectrum at roughly $1.4M to $1.6M depending on location, produces net proceeds that dwarf the Greater Phoenix median of $450,000.
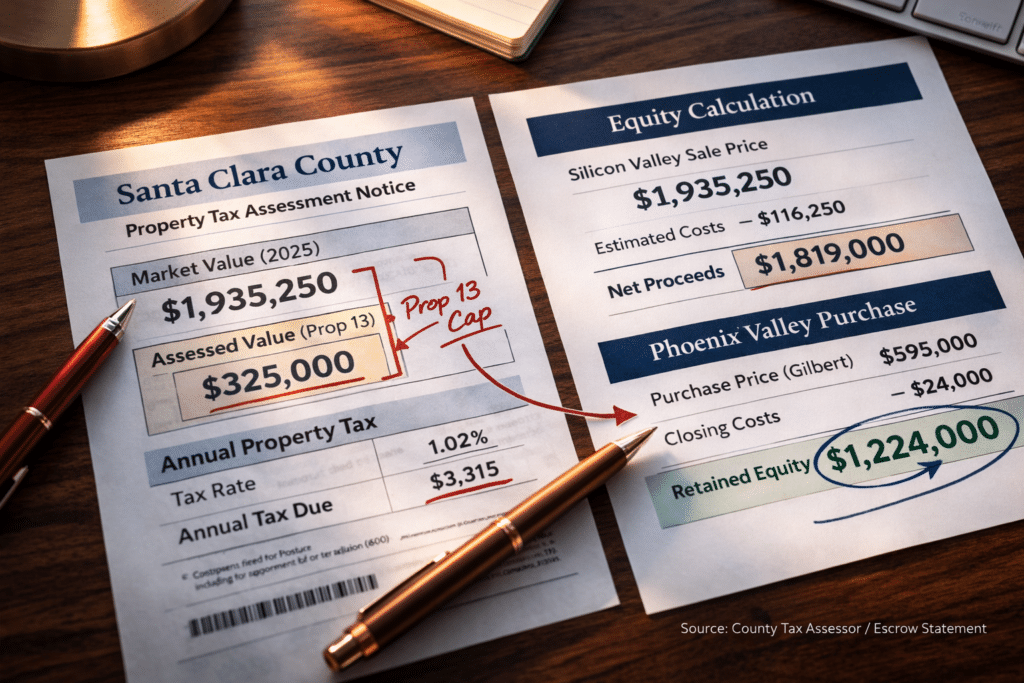
At the county median, the arithmetic is straightforward: a Santa Clara County seller at $1,935,250 carries estimated net proceeds of approximately $1,816,000 to $1,838,000 after standard 6% transaction costs. A purchase in Gilbert at $595,000 retains roughly $1,221,000 to $1,243,000. That retained capital isn’t a percentage or a ratio — it’s a dollar figure sitting on the balance sheet, available to generate returns that trapped home equity cannot produce.
Even under conservative assumptions, the retained-equity income potential is measurable. At a 4% annual yield, ~$1.23M in retained equity can generate about $49,000 per year in passive income before a single dollar of annual Arizona tax savings is counted.
The equity case compounds through a cost-basis reset. A Silicon Valley homeowner purchasing in the Phoenix Valley at $600,000 takes on mortgage, property tax, insurance, and ongoing carrying costs calibrated to a $600,000 asset not a $1.9M one. The annual delta across housing costs and state income tax on the income required to sustain the household is large, recurring, and cumulative.
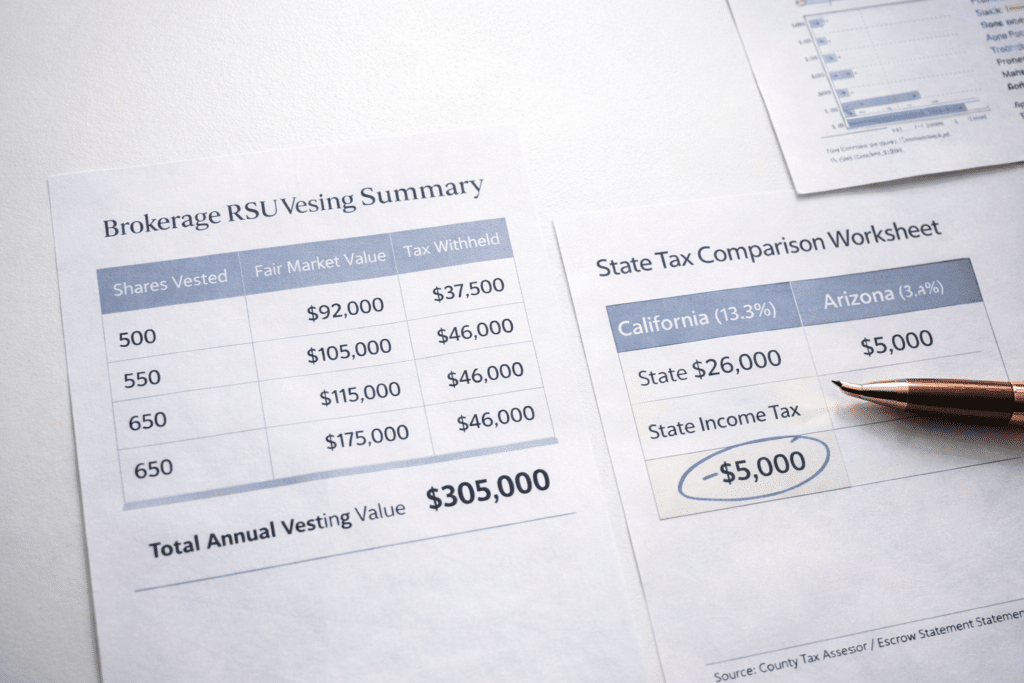
Silicon Valley homeowners face a tax variable that is structurally more central here than in other California origin markets: equity compensation. Restricted stock units (RSUs), incentive stock options (ISOs), non-qualified stock options (NQSOs), and employee stock purchase plan gains are all subject to California state income tax at the standard graduated rate up to 13.3% in the year the income is recognized, regardless of when the equity was granted.
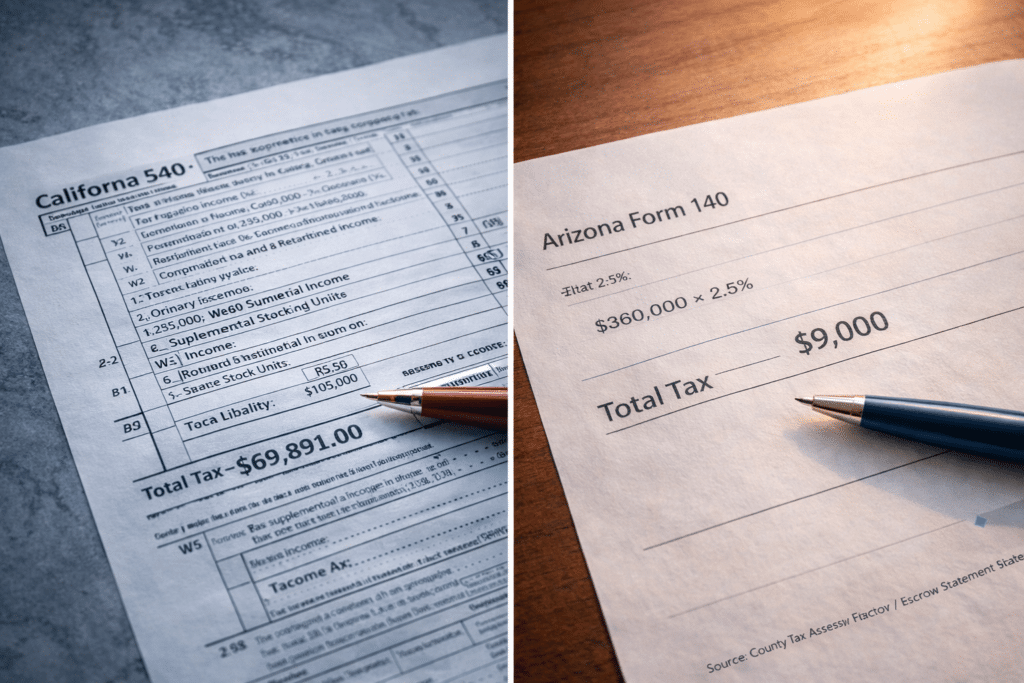
For a household with $400,000 in W-2 income plus $200,000 in RSU vestings in a single year, California’s effective state income tax on $600,000 in combined income can approach $60,000 to $75,000 depending on filing status, deductions, and marginal bracket exposure. Arizona’s 2.5% flat rate on the same $600,000 produces roughly $15,000 in state income tax a $45,000 to $60,000 annual delta attributable to equity-comp income exposure alone.
This isn’t limited to high-base-salary profiles. A household earning $150,000 in W-2 income plus $150,000 in annual RSU vestings a common mid-career technology profile can pay roughly $30,000 to $36,000 in California state income tax on $300,000 of combined income. Arizona’s flat 2.5% rate yields about $7,500. The annual delta: $22,500 to $28,500, repeated each year vesting continues.
At the Santa Clara County median, estimated net proceeds after transaction costs run approximately $1,816,000 to $1,838,000. Every Phoenix Valley destination produces retained equity. The decision point is which community matches the household’s space needs and financial objective.
Median: ~$595,000 (2025 YTD)
Estimated Equity Retained: ~$1,221,000–$1,243,000
Master-planned communities with HOA-maintained parks, pools, and ramadas; active new-construction pipeline and strong permit volume.
Median: ~$540,000
Estimated Equity Retained: ~$1,276,000–$1,298,000
Established resale inventory; proximity to the Price Road Corridor employment base; wide range from entry-level to executive.
Median: ~$1,180,000 (2025 YTD)
Estimated Equity Retained: ~$636,000–$658,000
Premium Valley inventory. County-median Silicon Valley sellers can access Scottsdale while still retaining six figures.
Range: ~$550,000--$700,000
Estimated Equity Retained: ~$1,116,000–$1,266,000
Newer builds along Loop 101/51 corridors; large master-planned footprint; HOA-governed amenities.
Median: ~$490,000 (2025)
Estimated Equity Retained: ~$1,326,000–$1,348,000
Broad inventory across a large footprint; strong value per square foot relative to East Valley medians.
Median: ~$430,000
Estimated Equity Retained: ~$1,386,000–$1,408,000
Maximum square footage per dollar; high new-construction volume; strongest retained-capital outcome at the county median.
Price data: ARMLS, Phoenix REALTORS year-to-date 2025 reports. Equity retained estimates assume 6% transaction costs on Santa Clara County sale plus standard Phoenix closing costs. Results vary based on sale price, loan payoff, and negotiated terms.
For Silicon Valley sellers above the county median, the retained equity scales quickly. A $2.6M sale (common in upper Santa Clara County submarkets) nets roughly $2.44M–$2.47M after transaction costs. Purchasing in Scottsdale at ~$1.18M still retains roughly $1.26M+ in net equity.
The headline comparison (13.3% vs. 2.5%) often understates the impact for Silicon Valley households because California’s progressive structure applies to wages, equity compensation, and many pass-through income streams at high marginal rates. Arizona’s flat 2.5% rate applies without graduation across income types.
A common misunderstanding for long-term Silicon Valley owners: Proposition 13 protects assessed value while you hold the asset, but ends completely at sale. The next property purchase is assessed at full market value wherever it occurs. In Maricopa County, a full assessment at $700,000 generates roughly $3,640 per year — often below what long-term owners already pay in California even on capped assessments.
| Tax Category | California (SC County) | Arizona (Maricopa Co.) |
|---|---|---|
| Top State Income Tax Rate | 13.3% (+1.1% surcharge) | 2.5% flat |
| RSU / NQ Option Income Treatment | Taxed as ordinary income up to 13.3% | Taxed at 2.5% flat |
| Effective Property Tax Rate | ~0.73% | ~0.52% |
| Avg Combined Sales Tax | ~9.0% (SC Co. avg) | 8.40% |
| Property Tax on $500K Assessed Value | ~$3,650–$4,000/yr | ~$2,600/yr |
| State Income Tax on $400K AGI | ~$30,000–$40,000/yr | ~$10,000/yr |
| Estate / Inheritance Tax | None | None |
Sources: Tax Foundation, 2025 State Income Tax Rates; California Franchise Tax Board; Maricopa County Treasurer; Arizona Department of Revenue
The San Jose–Sunnyvale–Santa Clara metro typically runs far above national cost-of-living baselines, driven primarily by housing but compounded through childcare, services, and insurance. Phoenix metro runs closer to the national average by comparison. The difference is the cost-of-living arbitrage that turns a one-time equity event into recurring monthly cash-flow leverage.
A household carrying a ~$7,200/month payment on a $1.4M San Jose home (6.5% rate, 20% down) could carry a comparable or larger home near the Gilbert/Chandler medians at roughly $2,600–$3,100/month — freeing up $4,100–$4,600 per month. Over ten years, that reallocation is ~$492,000–$552,000 in deployable capital, separate from tax savings.
Phoenix’s most obvious premium is summer cooling. Expect $250–$400/month electric bills from June through September in a typical single-family home. That seasonal cost is real, but concentrated in four months and often offset by lower property tax burden and the elimination of California’s year-round tiered electricity rate structure.

Santa Clara County’s outmigration is best understood through AGI flow data: it captures the economic weight of who is leaving, not just headcount. Tax Foundation analysis of IRS county-to-county migration data for the 2021–2022 filing year shows Santa Clara County posted a net AGI loss of $5.8B, the second-largest county-level loss in the nation.
This is a capital-driven migration. IRS income-bracket data shows higher-income brackets ($100K–$200K and $200K+) are moving at faster rates than lower brackets. Arizona’s flat 2.5% rate applies across wage income, equity compensation, and many investment income streams, producing larger absolute-dollar savings for higher earners.

Santa Clara County is not one market. The equity event scales by submarket. Snapshot ranges below are based on available county data and commonly reported local MLS ranges through 2025.
Estimated Range: ~$1,300,000–$1,700,000
San Jose spans multiple submarkets across the city. At ~$1.4M, net proceeds approximate $1.31M–$1.33M after transaction costs, producing six figures retained against every Phoenix Valley destination.
Estimated Median: ~$1,700,000
Net proceeds at ~$1.7M approximate $1.60M–$1.61M. Retained equity exceeds $1M versus most Valley purchases.
Estimated Range: ~$1,700,000–$2,200,000
Upper neighborhoods push toward Palo Alto price levels. Proceeds scale rapidly above $1.8M.
Estimated Median: ~$2,600,000
Net proceeds approximate $2.44M–$2.47M. A Scottsdale purchase at ~$1.18M still retains ~$1.26M+.
Estimated Range: ~$3,000,000–$3,500,000+
Net proceeds at $3.0M approximate $2.82M–$2.84M. Retained equity can exceed $1.6M even after a Scottsdale purchase.
Submarket ranges are estimates based on C.A.R. county medians and publicly available market reporting through 2025. Individual property values vary; verify current pricing with a licensed professional.