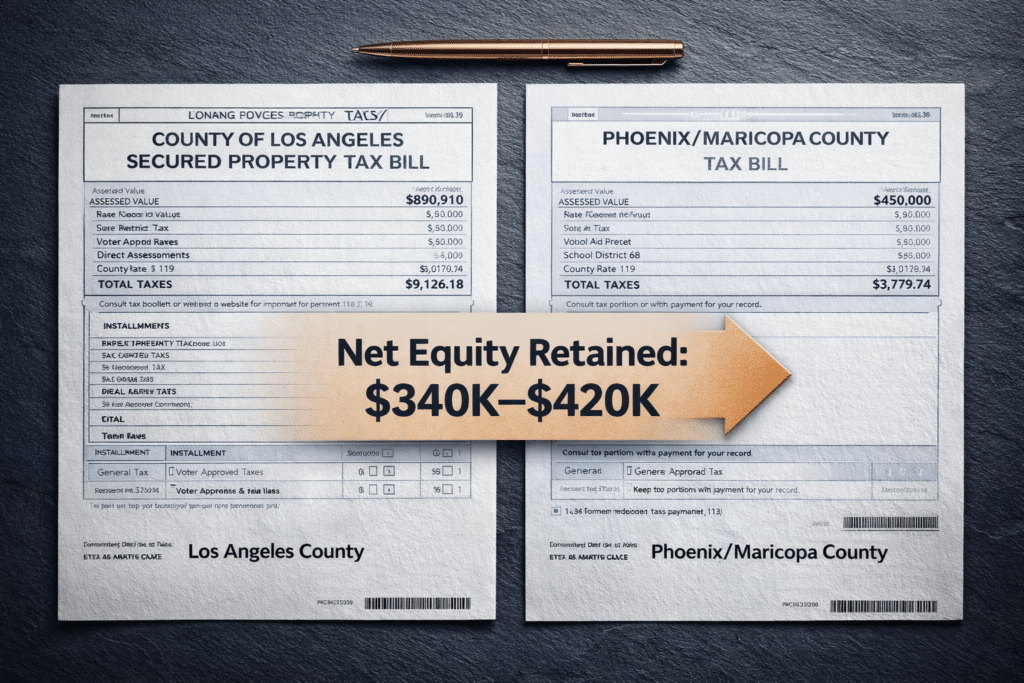
LA County’s median single-family home closed at $890,910 in December 2025. The Greater Phoenix median is $450,000. That’s not a pricing discrepancy — it’s a $440,000 head start on a fundamentally different financial position. And 11,558 Los Angeles County residents acted on that math in a single filing year.
Los Angeles homeowners relocating to Arizona aren’t downsizing their lives — they’re right-sizing their balance sheets. The arithmetic is straightforward: sell a median-priced LA County home at roughly $891,000, purchase a comparable or larger property in the Phoenix Valley at $450,000, and retain somewhere between $340,000 and $420,000 in net equity after transaction costs. That retained equity can eliminate a mortgage entirely, fund a renovation, or sit in a brokerage account generating returns that weren’t possible when it was locked inside four walls in Torrance or Pasadena.
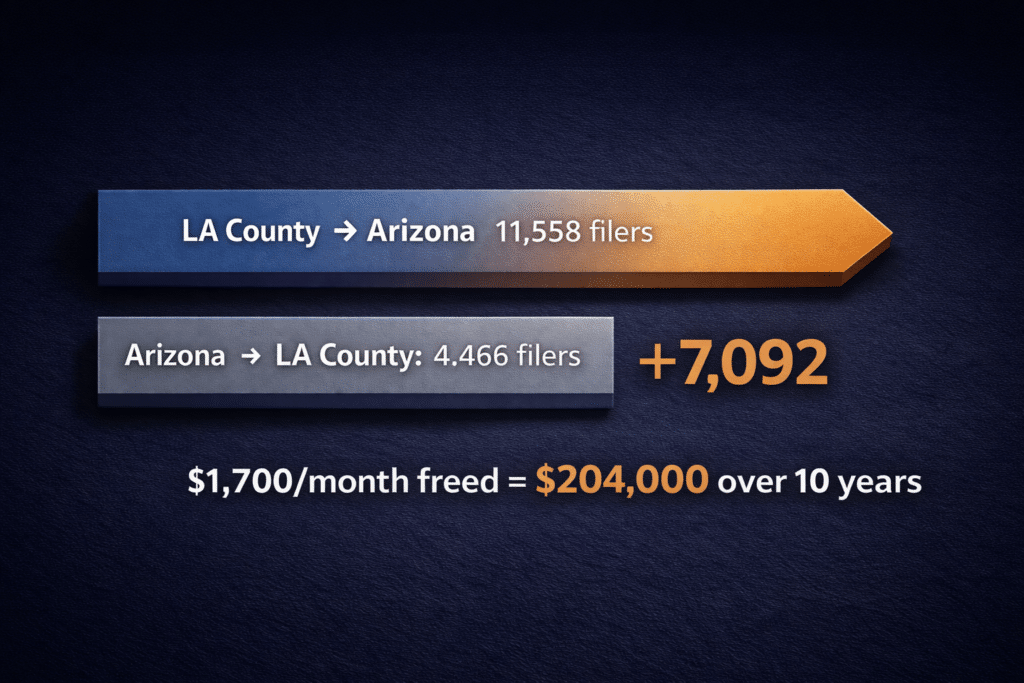
This is the financial logic driving the largest single-county migration corridor in America. According to IRS Statistics of Income data, 11,558 tax filers moved from LA County to Arizona in the 2021–2022 filing year. The net flow was +7,092 in Arizona’s favor — meaning for every two people who left LA for Arizona, roughly one moved the other direction. The migration is not just large; it’s structurally one-directional.
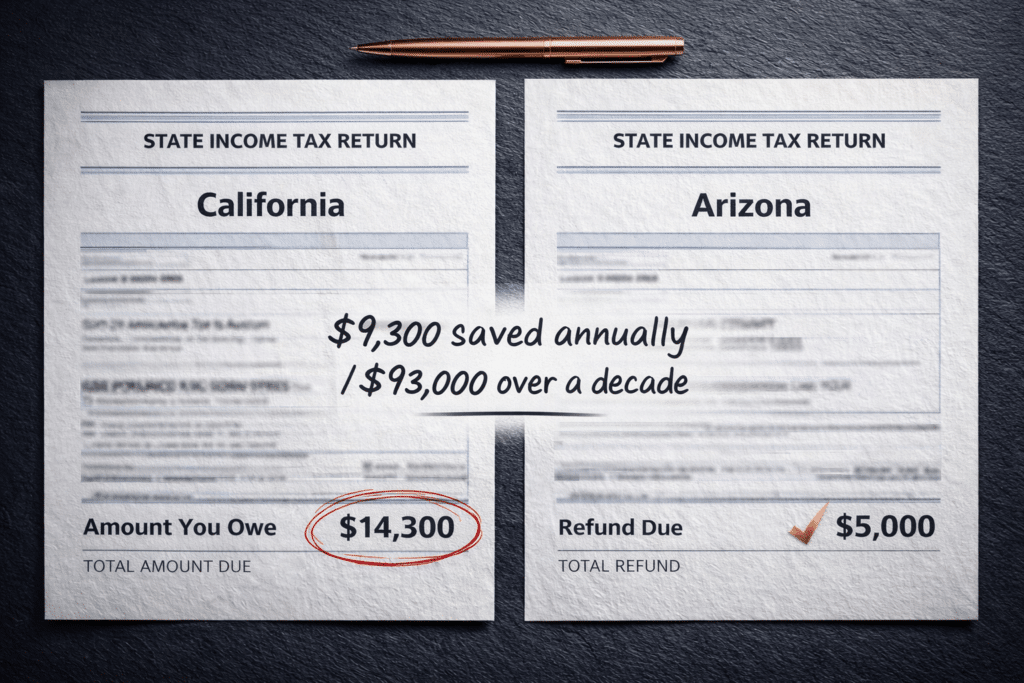
And the equity gap is only part of the equation. A household earning $200,000 in California pays roughly $15,000 to $20,000 more per year in state income tax than the same household in Arizona, where the flat rate is 2.5%. Over a decade, that delta alone compounds into $150,000 to $200,000 in cumulative savings — before factoring in property tax reductions, lower insurance premiums, and reduced day-to-day costs.
An LA County seller at the $891,000 median has a wide menu of destination communities, each with its own price point, lifestyle texture, and equity-retention profile. The table below maps the current market against what a median LA sale produces after standard transaction costs (estimated net proceeds: ~$810,000–$835,000).
The pattern is clear: an LA County seller at or above the median can purchase in most Valley communities and retain six figures in cash. A household selling at $1.1M — common in areas like Mar Vista, Sherman Oaks, or Glendale — could secure a 2,800-square-foot home on a quarter-acre lot in Gilbert for $600,000 and walk away with roughly $400,000 in net proceeds.

| Community | Median Price | Est. Equity Retained | Profile |
|---|---|---|---|
| Gilbert | ~$595,000 | ~$215K–$240K | Master-planned, top-rated school districts, strong HOA infrastructure |
| Chandler | ~$540,000 | ~$270K–$295K | Tech corridor proximity, established neighborhoods |
| Scottsdale | ~$1,180,000 | Premium positioning | The Valley's closest analog to coastal CA living |
| North Phoenix / Desert Ridge | $550K–$700K | ~$110K–$285K | Newer builds, Loop 101/51 access |
| Mesa | ~$490,000 | ~$320K–$345K | Broad inventory, entry-level to established |
| Surprise / Goodyear | ~$430,000 | ~$380K–$405K | Maximum sq ft per dollar, newer inventory |
Price data: ARMLS, Phoenix REALTORS year-to-date 2025 reports. Net equity estimates assume 6% transaction costs on the LA sale and standard Phoenix closing costs.
Most Los Angeles residents know California’s income tax is high. Fewer have run the numbers on what the gap looks like at the household level when you combine income tax, property tax, and sales tax into a single picture.
One variable LA homeowners often overlook: Proposition 13. If you’ve owned your LA home for a decade or more, your assessed value is well below market. The moment you sell, you exit the Prop 13 umbrella entirely. Your next property, wherever it is, gets assessed at full purchase price. In Maricopa County, that full assessment still results in a lower annual property tax bill than what most LA County homeowners pay on their capped assessments. At a $500,000 purchase price, expect an annual property tax bill of roughly $2,600 in Maricopa County — roughly $1,000 to $1,400 less than an equivalent assessment in LA County, depending on the taxing district.
| Tax Category | California (LA Co.) | Arizona (Maricopa County) |
|---|---|---|
| Top State Income Tax Rate | 13.3% (+ 1.1% surcharge) | 2.5% flat |
| Effective Property Tax Rate | ~0.73% | ~0.52% |
| Avg Combined Sales Tax | 9.5% (LA County avg) | 8.4% |
| Property Tax on $500K Home | ~$3,650–$4,000/yr | ~$2,600/yr |
| State Income Tax on $200K AGI | ~$14,300–$17,500/yr | ~$5,000/yr |
Sources: Tax Foundation 2025 State Income Tax Rates; Maricopa County Treasurer; California Franchise Tax Board; LA County Assessor.
The BLS Consumer Price Index for Los Angeles-Long Beach-Anaheim advanced 3.0% year-over-year through December 2025, running consistently above the national average. The LA metro’s overall cost of living sits roughly 40% or more above the U.S. baseline, driven primarily by housing but compounded by transportation, insurance, and grocery costs. The Phoenix metro, by contrast, runs roughly 3% to 6% above the national average.
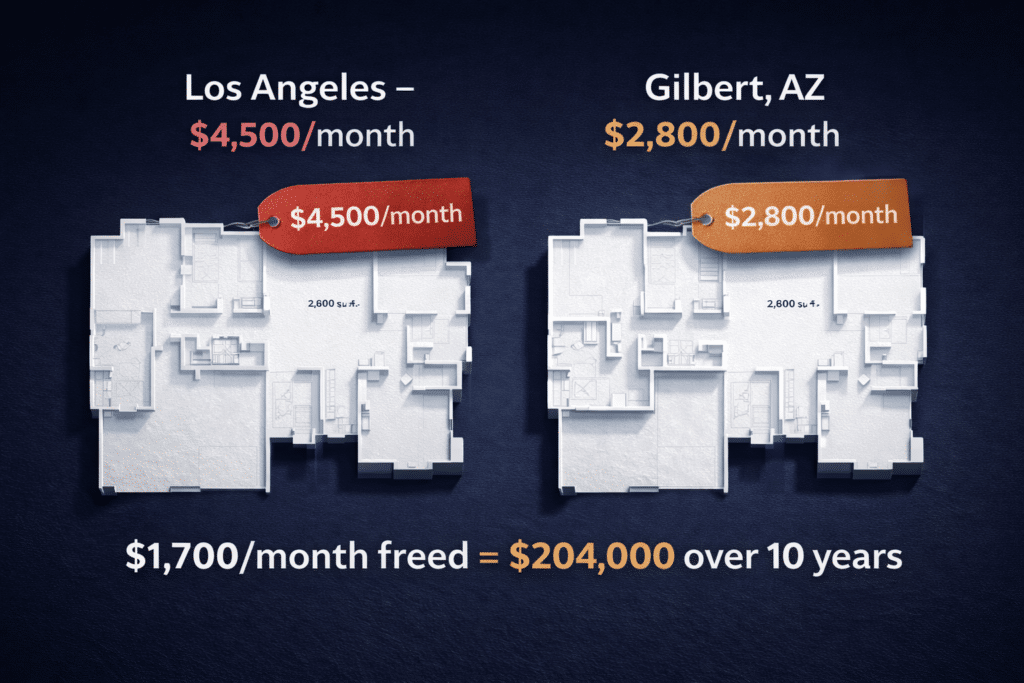
The most tangible difference for transplants is the mortgage payment. A household currently carrying a $4,500/month payment on an $890,000 LA home (at 6.5% with 20% down) could carry a comparable or larger home in Gilbert or Chandler at roughly $2,600 to $3,100/month — freeing up $1,400 to $1,900 in monthly cash flow. Over a decade, that reallocation compounds into six figures of additional savings or investment capital.
One category where Phoenix is not cheaper: summer cooling costs. Expect electric bills of $250 to $400 per month from June through September in a typical single-family home.
Los Angeles County is the single largest county source of Arizona-bound migration in the United States. IRS Statistics of Income data for the 2021–2022 filing year shows 11,558 tax filers moved from LA County to Arizona, with a net flow of +7,092 in Arizona’s favor. That net figure means LA County sent roughly 2.5 migrants to Arizona for every one it received in return.
The income profile of this migration is critical context. According to Tax Foundation analysis of IRS data, California’s net outmigration in the $100,000–$200,000 income bracket is accelerating faster than any lower bracket. These are homeowners with equity, dual-income households making calculated financial decisions. LA County alone lost $6.2 billion in net adjusted gross income through outmigration in recent IRS data.
Arizona was the second most popular destination state for California’s outmigrants, trailing only Texas. But for LA County specifically, the LA-to-Maricopa County corridor is the dominant pathway. The proximity (a 5.5-hour drive or 1-hour flight), the cultural familiarity, and the financial math all converge to make this the largest equity migration corridor on the West Coast.